

2
National Institutes of Health Individual Mentored Career Development Awards Program
Evaluation Working Group
David Banks, NINR
Juliana Blome, NIGMS
Liza Bundesen, NIMH
Jim Corrigan, NCI
Genevieve deAlmeida-Morris, NIDA
Christie Drew, NIEHS
Bettie Graham, NHGRI
Sarah Glavin, NICHD
Milton Hernandez, OD
Cheryl Howard, NHLBI
Chyren Hunter, NIA
Henry Khachaturian, OD
Linda Kupfer, FIC
Karl Malik, NIDDK
Julie Mason, NCI
Carol Merchant, NCRR
Jim Onken, OD
Wilma Peterman-Cross, NIAMS
Louise Rosenbaum, NIAMS
Ann Rothgeb, NHLBI
Wally Schaffer, OD
Larry Solomon, NCI
Brent Stanfield, NIDDK
Jane Steinberg, NIMH
Melissa Stick, NIDCD
Jennifer Sutton, OD
Roger Sorenson, NIDA
Rod Ulane, OD
David Wilde, NCRR
Study Directors
Laurel Haak and Joshua Schnell
Discovery Logic, a Thomson Reuters business
Analysts
Duane Williams, Leo DiJoseph, Matt Probus, Faye Liu, Yvette Seger
Discovery Logic, a Thomson Reuters business
Partial support for this study came from the NIH Evaluation Set-Aside Program, 10-5203 OD-OER-OEP

3
TABLE OF CONTENTS
LIST OF TABLES ………………………………………………………………………………………………………………………………………………………..6
LIST OF FIGURES ............................................................................................................................................................ 7
EXECUTIVE SUMMARY ................................................................................................................................................... 8
Who is Applying for and Receiving Individual Mentored Career Development Awards? ......................................... 8
What is the Impact of Participation on Research Productivity and Independent Careers? ...................................... 9
Implications for Program Policy and Recommendations ........................................................................................ 10
INTRODUCTION ........................................................................................................................................................... 11
NIH Individual Mentored Career Development Programs ...................................................................................... 12
Evaluation Objectives and Research Design ............................................................................................................ 12
Logic Model. ........................................................................................................................................................ 13
Data Sources. ...................................................................................................................................................... 14
Methods for Analyzing Program Impact. ............................................................................................................ 14
Study Sample. ..................................................................................................................................................... 14
Report Structure ...................................................................................................................................................... 17
PART I: WHO IS APPLYING?.......................................................................................................................................... 18
1.1 Overview .................................................................................................................................................... 18
1.2 Methods ..................................................................................................................................................... 18
1.3 Applications, Awards, and Demographics .................................................................................................. 18
1.3.1 Applications and Awards by Program and IC ......................................................................................... 18
1.3.2 Distribution of Degrees among Applicants and Awardees .................................................................... 19
1.3.3 Sex Distribution among Applicants and Awardees ................................................................................ 21
1.3.4 Applications and Awards by Race/Ethnicity .......................................................................................... 23
1.3.5 Scientific Specialty of Applicants ........................................................................................................... 25
1.3.6 Applicant Age and Average Years since Terminal Degree ..................................................................... 27
1.3.7 Prior Support of Applicants and Awardees ............................................................................................ 29
PART II: SELECTED OUTCOMES .................................................................................................................................... 32
2.1 Overview .................................................................................................................................................... 32
2.2 Outcome Analysis Methodology ................................................................................................................ 32
2.2.1 Deriving Comparison Cohorts ................................................................................................................ 32
2.2.2 Data Sources for Outcomes Analysis ..................................................................................................... 33
2.3 Composition of the Study Cohorts ............................................................................................................. 34
2.3.1 Activities, ICs, and Fiscal Years ............................................................................................................... 34

4
2.3.2 Demographic Distribution...................................................................................................................... 36
2.4 Publications and Citations .......................................................................................................................... 36
2.4.1 Publication Outcomes ............................................................................................................................ 36
2.5 Subsequent Participation in NIH Grant Programs ...................................................................................... 37
2.5.1 Composite Cohort Outcomes ................................................................................................................ 37
2.5.2 Subsequent NIH Applications and Awards by Sex ................................................................................. 39
2.5.3 Subsequent Grant Applications and Awards by Degree ........................................................................ 41
2.5.4 Subsequent Awards by IC ...................................................................................................................... 44
2.6 Medical School Faculty Rank Progression .................................................................................................. 44
2.7 Does Participation in Mentored K Programs Delay the Start of Independent Research Careers? ............ 45
2.8 Does Participation in K Programs Generally Increase R01 & RPG Success Rates? ..................................... 47
2.9 Does Participation in K Programs Increase the Duration of Research Careers? ........................................ 48
PART III: SUMMARY AND POLICY IMPLICATIONS ........................................................................................................ 51
3.1 Mentored K Evaluation Conclusions .......................................................................................................... 51
3.2 Policy Implications...................................................................................................................................... 51
Appendix I: Data Selection Methods ........................................................................................................................... 54
A.1.1. Determination of Application Pool ............................................................................................................ 54
A.1.2. Methods Used for Determination of Demographics .................................................................................. 55
A.1.2.a. Identification of IMPAC II Person Relevant Records ............................................................................ 55
A.1.2.b. Prior NIH Support ................................................................................................................................. 55
A.1.2.c. Birth Date, Race/Ethnicity, and Sex ...................................................................................................... 56
A.1.2.d. Degree ................................................................................................................................................. 57
A.1.2.e. Academic Rank ..................................................................................................................................... 58
A.1.3. Methods Used to Identify Applications “On-The-Bubble” ......................................................................... 59
A.1.4. Determination of Subsequent NIH Activity ................................................................................................ 60
A.1.5. Matching MEDLINE Publication Records to Applicants .............................................................................. 60
APPENDIX II: NIH Institute and Center (IC) Abbreviations ........................................................................................ 61
APPENDIX III: Applicant Degree Classification ........................................................................................................... 62
APPENDIX IV: Dual Degrees ....................................................................................................................................... 63
APPENDIX V: Doctorate Records File (DRF) Fields of Study ...................................................................................... 64
APPENDIX VI: Department/Subunit of Medical School Appointments ...................................................................... 65
APPENDIX VII: Prior Support for K Applicants ............................................................................................................. 66
APPENDIX VIII: Data Sources for Demographic Variables ............................................................................................ 68
APPENDIX IX: Subsequent Grant Outcomes for Full Population, by Sex ................................................................... 69
APPENDIX X: Subsequent Grant Outcomes for Full Population, by Degree ............................................................. 70


6
LIST OF TABLES
Table 1. Study group .................................................................................................................................................. 12
Table 2. Study group timeframe, applications, and awards, by K program ............................................................... 15
Table 3. Distribution of applications and awards by K activity and IC ....................................................................... 19
Table 4. Comparison of applications, by sex .............................................................................................................. 21
Table 5. Race/Ethnicity of K program applicants ....................................................................................................... 24
Table 6. Top fields of study and departments for K01 Applicants (FY2000 – FY2005) .............................................. 26
Table 7. Top fields of study and departments for K08 Applicants (FY1990 – FY2005) .............................................. 26
Table 8. Top fields of study and departments for K23 Applicants (FY2000 – FY2005) .............................................. 27
Table 9. Age of applicant ........................................................................................................................................... 27
Table 10. Prior NIH traineeship (T), fellowship (F), and loan repayment (L) support (Percent of cohort) .................. 30
Table 11. All prior NIH support (Percent of cohort) .................................................................................................... 30
Table 12. Applicants in each bubble cohort, by fiscal year .......................................................................................... 34
Table 13. Applicants in each bubble cohort, by IC ....................................................................................................... 34
Table 14. Demographic characteristics of K program bubbles .................................................................................... 36
Table 15. Applicant publication outcomes .................................................................................................................. 37
Table 16. Applicant faculty progression outcomes ..................................................................................................... 45
Table 17. Average time to R01 application for K applicant cohorts ............................................................................ 46
Table 18. Average time to RPG (non-R01) application for K applicant cohorts ........................................................... 46
Table 19. NIH-wide new R01 success rates of mentored K awardees and other investigators (FY1990 - FY2009)..... 47
Table 20. NIH-wide new RPG success rates of mentored K awardees and other investigators (FY1990 - FY2009) .... 48
Table 21. Percent RPG and overall funded years for K08 applicants ........................................................................... 49

7
LIST OF FIGURES
Figure 1. Logic model for K program evaluation ........................................................................................................ 13
Figure 2. K01 applications, awards, and award rates, FY2000 - FY2005 .................................................................... 15
Figure 3. K08 applications, awards, and award rates, FY1990 - FY2005 .................................................................... 16
Figure 4. K23 applications, awards, and award rates, FY2000 - FY2005 .................................................................... 16
Figure 5. Degree distribution of applicants, by K activity .......................................................................................... 20
Figure 6. Sex distribution of applicants and awardees .............................................................................................. 21
Figure 7. Sex distribution of K08 applicants ............................................................................................................... 22
Figure 8. Degree distribution of awardees by sex, by K activity ................................................................................ 23
Figure 9. Race/Ethnicity distribution of applicants and awardees ............................................................................ 25
Figure 10. Years since terminal degree, by activity ..................................................................................................... 28
Figure 11. Years since terminal degree, by degree type.............................................................................................. 28
Figure 12. Years since terminal degree, by sex ............................................................................................................ 29
Figure 13. Outcome analysis methodology: The “funding bubble” ............................................................................. 32
Figure 14. Identifying comparable applicants and composing a funding bubble ........................................................ 33
Figure 15. Subsequent NIH grant outcomes, by K program ........................................................................................ 38
Figure 16. Percentage of funded applicants with subsequent RPG applications, by sex ............................................ 39
Figure 17. K01 applicant grant outcomes, by sex ........................................................................................................ 40
Figure 18. K08 applicant grant outcomes, by sex ........................................................................................................ 40
Figure 19. K23 applicant grant outcomes, by sex ........................................................................................................ 41
Figure 20. Percentage of funded applicants with subsequent RPG applications, by degree ...................................... 42
Figure 21. Percentage of unfunded applicants with subsequent RPG applications, by degree .................................. 42
Figure 22. K01 applicant grant outcomes, by degree .................................................................................................. 43
Figure 23. K08 applicant grant outcomes, by degree .................................................................................................. 43
Figure 24. K23 applicant grant outcomes, by degree .................................................................................................. 44
Figure 25. Subsequent renewal (Type 2) grant application and success rates (K08 FY1990 - FY2000 cohort) ........... 49

8
EXECUTIVE SUMMARY
As part of its charge to develop the nation’s biomedical research workforce, NIH provides career development
awards to foster the independence of promising new investigators by providing mentorship, salary support, and
protected time to develop a research program. Since 1957, NIH has made over 19,000 career development, or “K”,
awards, at a total cost of more than $8 billion.
Since 1987, when the NIH-wide program of mentored career development awards was last evaluated, there have
been a number of changes to the program and the specific types of awards offered. This study was undertaken to
update the earlier NIH-wide evaluation of the K award outcomes, to determine if the program is meeting its goals,
and to identify possible leverage points for program improvements.
In general, NIH career development awards fall into two major categories: those in which the candidate works with
an established investigator (mentored), and those in which the candidate has reached independence as a
researcher, but seeks to obtain new skills, mentor students or new investigators, or develop new curricula
(independent). Because individual mentored awards represent more than 60 percent of the NIH career
development budget, we chose to focus on individual mentored career development and the three types of
awards most widely used:
Mentored Research Scientist Development Award (K01) – Provides mentored research and career
development experiences for new biomedical scientists, primarily research doctorates, or those entering new
fields.
Mentored Clinical Scientist Development Award (K08) – Provides mentored research and career
development experiences for health professional doctorates in fields of biomedical and behavioral research.
Mentored Patient-Oriented Research Career Development Award (K23) – Provides mentored research and
career development experiences for health professional doctorates in patient-oriented research.
The key questions addressed in this evaluation were:
1. What are the characteristics of K applicants and awardees?
2. What proportion of K applicants and awardees are retained in the biomedical research workforce? What
proportion become NIH-funded Program Directors/Principal Investigators (PD/PIs)?
3. Do career outcomes differ for funded vs. unfunded applicants? In particular, does participation in the K
awards program affect subsequent scientific productivity?
4. Do the evaluation results suggest any areas for program improvements?
Who is Applying for and Receiving Individual Mentored Career Development Awards?
Consistent with the goals of the specific K activities assessed, most applicants to the K01 program were PhDs,
while most applicants to the K08 and K23 programs were MDs and MD/PhDs. While the absolute number of
applicants of all major degree types increased over the period of study, there was a decline in the proportion
of MDs in the applicant pool and an increase in the proportion of MD/PhDs and PhDs.
9
K01 and K23 applicants were evenly distributed by sex, but for the K08 program, males consistently accounted
for over two-thirds of the applicant pool during the 15 year study period.
The race/ethnicity distribution of K applicants was slightly but significantly different from the distribution of
PhD and medical school graduating classes, with disproportionately fewer Hispanics, Blacks, and Native
Americans, and more Asians applying for career development awards.
There were no differences in K award rate by degree, sex, or race/ethnicity.
The median applicant age was 37 years. K01 applicants were typically three to five years past their terminal
degree, while K08 and K23 applicants were generally seven to nine years beyond their terminal degrees,
reflecting the years of post-degree clinical training undertaken by most clinician scientists and patient-
oriented researchers. There were small, but notable, numbers of applicants 15 or more years from degree,
particularly for the K23 award.
What is the Impact of Participation on Research Productivity and Independent
Careers?
Overall, mentored career awards appeared to retain participating investigators in research careers and
contribute to their subsequent research success:
K awardees were significantly more likely to have subsequent research publications than comparable
unfunded applicants.
K awardees were more likely than comparable unfunded applicants to apply for subsequent NIH
research awards.
Among those who could be followed for at least a decade, K awardees had a higher percentage of years
with subsequent NIH support and were more likely to apply for and receive at least one competitive
renewal of an R01 grant than comparable unfunded applicants.
Collectively, researchers who had held a prior K01, K08, or K23 award had a significantly higher R01
award success rate than the pool of individuals with no prior career development support.
Among various types of K awardees, however, there were differences in the impact of career development
support:
K08 and K23 recipients applied for and received R01 awards within the same time period as their
comparable unfunded counterparts, but K01 awardees were likely to apply for R01 awards later than
the comparison group of unfunded applicants.
K08 and K23 awardees had significantly higher rates of receiving subsequent NIH research awards than
a matched group of unfunded applicants, but there were no significant differences between K01
awardees and unsuccessful applicants.
Male K01 and K23 awardees were more likely to apply for and receive subsequent R01 and RPG awards
than their female counterparts. Among K08 awardees, who were followed for longer periods of time,
there were no differences between men and women in subsequent applications or awards.
K awards appeared to have the greatest impact on the subsequent NIH research involvement of MD
recipients, followed by MD/PhD recipients, and then PhD recipients.
10
Implications for Program Policy and Recommendations
The results of this evaluation indicate that the individual mentored K programs are meeting their stated goals of
fostering the independent research careers of early-stage clinicians and research doctorates. However, variations
among the different types of NIH mentored career development awards and their participants suggest several
areas for further consideration:
What is the best form of career development for PhD recipients who have had substantial research
training and career development in the course of earning their research doctoral degrees?
What are the best ways to attract under-represented minority researchers to biomedical research
careers?
Is NIH doing all it can to ensure the success of women investigators, in the short term as well as the long
term?
Should NIH be more receptive to mid-career investigators turning to patient-oriented research after
developing their clinical expertise?

11
INTRODUCTION
The National Institutes of Health (NIH) launched its career development program in 1957 to help develop the
nation’s biomedical research workforce by providing protected research time to promising investigators following
the completion of their formal doctoral and postdoctoral training. Since the program’s inception, NIH has made
over 19,000 career development, or “K”, awards, at a total cost of more than $8 billion.
In general, NIH career development awards fall into two major categories: those in which the candidate works with
an established investigator (i.e., mentored), and those in which the candidate has attained research independence
but seeks a period of protected time to obtain experience in a new research area, to mentor others, or to develop
new educational curricula (i.e., independent). Most career development awards are targeted to individuals, but
several types of awards are designated for institutions and support the development of formal programs with new
curricula and career development activities with the institution selecting the participants.
Over the years, the number, nature, and specific types of career development awards have varied as the NIH has
sought to address the changing needs of the research workforce. More than 20 different types of K awards have
been offered since 1957. Today, NIH supports 13 types of career development awards. Individual mentored
awards account for the largest share of NIH’s career development funding.
To date, a number of evaluations of the K award have been conducted, but they have often been relatively
narrowly focused on specific types of K awards or specific NIH Institutes and Centers (ICs). One exception was a
1987 evaluation of NIH research career development awards that assessed several similar types of individual
mentored awards used across the NIH at the time.
1
This study found that K awards were made to the intended
early career audience and, by every measure examined, awardees had longer careers as NIH principal investigators
and were more likely to lead center grants, program project grants, and training grants. Recipients of K awards
were also more likely to direct large research projects, and publish more and higher quality articles than either
unsuccessful applicants for K awards or R01 recipients at the same career stage who did not receive career
development support. The evaluators concluded, however, that the majority of these positive outcomes were not
due to participation in the career development program, but attributable instead to the ability of review groups to
identify candidates who were most likely to succeed in research careers. The one area in which a K award did
appear to make a difference was in the length of a recipient’s subsequent research career.
The current study provides an NIH-wide evaluation of the individual mentored K awards. It documents
characteristics of recent applicants and awardees, and extends previous studies by establishing a comparison
group of matched unfunded applicants to test the impact of program participation on research careers, including
publications, grant applications and awards, and faculty appointments. This assessment seeks to determine the
extent to which the program is meeting its goals and identify opportunities for improvements.
1
Grace Carter, et al. An Evaluation of the NIH Research Career Development Award. (Santa Monica, CA: Rand,
1987).

12
NIH Individual Mentored Career Development Programs
NIH Individual Mentored Career Development awards are a key component of the NIH strategy to build the
biomedical research workforce. The Mentored Research Scientist Development Award (K01), the Mentored
Clinical Scientist Development Award (K08), and the Mentored Patient-Oriented Research Career Development
Award (K23), the focus of this evaluation, provide doctoral-level researchers and health professionals with three to
five years of support for a career development experience at critical stages in their research careers. These awards
are typically granted to individuals who have recently finished their doctoral and post-doctoral training and are
transitioning to faculty positions; they provide salary support and limited research funds for a combination of
intensive research and mentored training to advance participant careers to independent status. These three K
programs are supported by most of the NIH ICs and represent more than 60 percent of NIH career development
awards and funding. In fiscal year (FY) 2010, NIH made 604 new K01, K08, and K23 awards at a total cost of $86.2
million dollars.
Evaluation Objectives and Research Design
NIH has undertaken this evaluation of the individual mentored career development awards to assess their
effectiveness in enhancing the productivity of early career scientists and to identify potential areas for program
improvements. Table 1 provides an overview of the study group.
Table 1. Study group
Activity
Description of Program Goals
2
ICs included
3
Year Range
K01
Provides support and protected time for an intensive,
supervised career development experience leading to
research independence in the biomedical, behavioral,
or clinical sciences. Many, but not all, ICs that offer
K01 awards limit eligibility to individuals with a PhD or
equivalent degree.
NIAAA, NIAMS, NIBIB, NIDA,
NIDDK, NIEHS, NIMH, FIC
FY2000 -
FY2005
K08
Provides support and protected time to individuals
with a health-professional doctoral degree for an
intensive, supervised research career development
experience in the fields of biomedical and behavioral
research.
NIAAA, NIAMS, NIBIB, NIDA,
NIDDK, NIEHS, NIMH, NINR,
NCCAM, NIDCR, NIA,
NICHD, NEI, NIDCD, NINDS,
NIAID, NCI, NHLBI, NIGMS
FY1990 -
FY2005
K23
Provides support and protected time to individuals
with a health-professional doctoral degree for an
intensive, supervised research career development
experience in patient-oriented research.
NIAAA, NIAMS, NIBIB, NIDA,
NIDDK, NIEHS, NIMH, NINR,
NCCAM, NIDCR, NIA,
NICHD, NEI, NIDCD, NINDS,
NIAID, NCI, NHLBI, NIGMS,
NHGRI, NCRR
FY2000 -
FY2005
2
Descriptions of the three K award activities examined in this study, adapted from the NIH website, available at
http://grants.nih.gov/training/careerdevelopmentawards.htm. (Accessed December 6, 2009).
3
See Appendix II for acronym definitions.

13
Logic Model. A logic model (Figure 1) was developed to categorize critical components to be measured and
analyzed. As displayed below, the model illustrates how participant characteristics, program features, and external
factors contribute to career development outcomes.
Figure 1. Logic model for K program evaluation
The evaluation questions focused on two major components of the logic model:
Program & Participant Characteristics
How were applications distributed among the examined programs and ICs?
What was the sex and racial/ethnic distribution of the applicants and awardees?
What was the degree distribution of the applicants?
What were the predominant fields of study for the applicants?
How soon after earning a terminal degree were candidates applying for K awards?
What percentage of applicants and awardees had prior NIH traineeship, fellowship, or loan repayment
support?
Selected Outcomes
Did K awardees have more publications than matched unfunded applicants? Were their publications cited
more frequently? Did they have a greater impact on the field?
Compared with matched unfunded applicants, were K awardees more likely to seek and receive
subsequent NIH research project grants (RPGs)? What was the time between K award and subsequent
NIH research grant activity?
Were K awardees more likely to hold medical school faculty positions than matched unfunded applicants?
Were K awardees more likely to remain in research careers than their unfunded counterparts?

14
Data Sources. A number of databases were used to support the evaluation. We used the NIH Information for
Management, Planning, Analysis, and Coordination (IMPAC II)
4
grants database to identify K applicants and
awardees, and obtain data on their characteristics and NIH applications and awards. We also accessed auxiliary
data sources that had been matched to IMPAC II, including the Doctoral Record File (DRF)
5
, the Faculty Records
File
6
, and the Enumeration table
7
to obtain additional information on applicant degree characteristics, subsequent
grant activity, and current position. Publications were obtained from the National Library of Medicine (NLM)
MEDLINE database and bibliometric data from the Thomson Reuters Web of Science database.
Methods for Analyzing Program Impact. To measure program impact, multivariate models were used to create
matched groups of funded and unfunded applicants for each award program (see Appendix I). Using a regression
discontinuity design based on priority score, applicants with an equal chance of being funded were identified and
then divided into funded and unfunded groups. By restricting the outcome analysis to funded and unfunded
applicants with similar scores, we were able to isolate the effect of the career development programs themselves
from the effect of reviewers choosing superior candidates. Grant, degree, and current position information was
obtained for applicants, and publications were matched to each applicant using an automated match process with
manual verification. T-tests and Two Proportion Z statistical tests were used to test for differences between
funded and unfunded groups. Statistical significance is reported at the following levels:
1. P < 0.01 99 percent confidence
2. P < 0.05 95 percent confidence
3. P > 0.05 not statistically significant
Study Sample. The study sample for each career development program was defined initially by the group of
participating ICs. In the case of the K01 program, however, the sample for evaluation was further limited to those
ICs shown in Table 1 that utilize the award to broadly support the career development of new investigators. To
ensure a comparable group of K01 applicants for evaluation, ICs that use the K01 to support the re-training of mid-
career investigators, to support investigators only in specific targeted fields, or to foster diversity in the research
workforce were not included.
Also driving the selection of samples and time periods for study was the need to have a sufficient number (i.e.,
greater than 200) of applications per year and enough time following the award (i.e., at least five years) to allow
for outcome analyses. The total sample included 12,350 applications
8
received from FY1990 (in the case of K08) or
FY2000 (in the case of K01 and K23) to FY2005, of which 5,600 were awarded (Table 2).
It should be noted here that there is a distinction between the “Award Rate” provided in this text and the “Success
Rate” commonly reported by the National Institutes of Health. The “Success Rate” counts grant application
amendments each time they occur in a new fiscal year (applications with one or more amendments in the same
fiscal year are counted once). The “Award Rate” uses only the last funded or unfunded amendment. Therefore,
4
http://era.nih.gov/impacii/index.cfm
5
Data from the National Science Foundation Survey of Earned Doctorates matched to IMPAC II person profiles.
6
Data from the Association of American Medical Colleges Faculty Roster matched to IMPAC II person profiles.
7
Data from grant progress report Key Personnel tables, FY2005 - FY2007, linked to IMPAC II person profiles.
8
Only new competitive (Type 1) grants were considered. Competitive renewals (Type 2) and all other renewal
grants were not included in this evaluation. If a single applicant submitted applications to the same activity in
multiple ICs in a single year, all applications were counted. If an applicant submitted an amended Type 1
application, either the awarded or the most recent application was counted.

15
regardless of the number of grant amendments, or the fiscal year in which they occurred, each grant application is
counted just once.
Table 2. Study group timeframe, applications, and awards, by K program
Activity
Timeframe
Number of
Applicants
Number of
Awardees
Number of
Applications
Number of
Awards
Award Rate
(# Awards/
# Applications)
K01
FY2000 - FY2005
1,150
600
1,513
600
40%
K08
FY1990 - FY2005
5,982
3,745
7,754
3,751
48%
K23
FY2000 - FY2005
2,271
1,248
3,083
1,249
41%
Total
9,403
5,593
12,350
5,600
45%
Note: There were 112 applicants with applications to two NIH Individual Mentored K program activities or to two different ICs.
Source: IMPAC II
K01. The study included 1,513 applications across eight NIH ICs participating in the Mentored Research Scientist
Development Award (K01) program during FY2000 - FY2005. The K01 cohort was limited to applications to IC
programs that share similar broad programmatic goals.
9
Though NIH has offered the K01 award since 1968, the
number of applications and awards prior to 2000 was not sufficient for a rigorous evaluation. Applications,
awards, and award rates are shown in Figure 2.
Figure 2. K01 applications, awards, and award rates, FY2000 - FY2005
Source: IMPAC II
9
Some NIH ICs use the K01 award to allow established investigators to train in new fields or to foster workforce
diversity. To create a comparable pool of applicants and awardees, this evaluation excluded ICs that used the K01
award for targeted purposes, and focused on ICs sharing the same broad programmatic goals of fostering new
investigators: NIAAA, NIAMS, NIBIB, NIDA, NIDDK, NIEHS, NIMH, and FIC.

16
K08. The study included 7,754 applications across all 19 NIH ICs participating in the Mentored Clinical Scientist
Research Career Development Award (K08) program during FY1990 - FY2005 (Figure 3).
Figure 3. K08 applications, awards, and award rates, FY1990 - FY2005
Source: IMPAC II
K23. The study included 3,083 K23 applications across all 21 ICs participating in the Mentored Patient-Oriented
Research Career Development Award (K23) for the FY2000 - FY2005 time period, shown in Figure 4. The K23 award
was first introduced in 1998; by 2000, the number of applications and awards had grown enough to permit
evaluation.
Figure 4. K23 applications, awards, and award rates, FY2000 - FY2005
Source: IMPAC II
17
Report Structure
This report is structured in three parts. Part I provides a detailed description of program and participant
characteristics. Part II focuses on methods and results of the outcomes assessment. A summary of findings and
conclusions is provided after both sections. Part III summarizes the major findings and potential policy
implications. Appendices provide supporting details on degree classification, abbreviations, data collection
methods, outcome methods, and data sources.

18
PART I: WHO IS APPLYING?
1.1 Overview
In this section, we investigate the characteristics of the applicants for the K01, K08 and K23 award programs to
provide a clear picture of those who apply for and receive the awards. We also consider the correlation between
various applicant characteristics, applications, and award rates.
1.2 Methods
We used the following parameters to evaluate the applicants and awardees of each program: (1) applications by K
activity and funding NIH IC; (2) degree type; (3) sex; (4) race/ethnicity; (5) field of training or specialty; (6) years
since qualifying degree; (7) prior research support. Single and cross-parameter analyses were performed for each
award type. Single parameter analysis was used to examine trends, and cross-parameter analyses were used to
evaluate conditional dependencies, such as the relationship between sex and degree.
1.3 Applications, Awards, and Demographics
In this section, we review the characteristics of applicants and awardees, and consider whether mentored K
programs are reaching their target audience. Study samples are shown above, in Table 1.
1.3.1 Applications and Awards by Program and IC
Table 3 lists the applications, awards, and application award rates by IC for each K activity included in the
evaluation. Across programs and years, the average award rate was 45 percent.

19
Table 3. Distribution of applications and awards by K activity and IC
K01
(FY2000 - FY2005)
K08
(FY1990 - FY2005)
K23
(FY2000 - FY2005)
IC
Application
(% total)
Award
(% total)
Award
Rate
Application
(% total)
Award
(% total)
Award
Rate
Application
(% total)
Award
(% total)
Award
Rate
NIMH
534 (35%)
190 (32%)
36%
367 (5%)
166 (4%)
45%
532 (17%)
199 (16%)
37%
NIDDK
476 (31%)
210 (35%)
44%
1,072 (14%)
587 (16%)
55%
254 (8%)
101 (8%)
40%
NIAMS
173 (11%)
52 (9%)
30%
310 (4%)
138 (4%)
45%
100 (3%)
40 (3%)
40%
NIDA
173 (11%)
74 (12%)
43%
86 (1%)
48 (1%)
56%
133 (4%)
59 (5%)
44%
NIAAA
76 (5%)
37 (6%)
49%
31 (0%)
14 (0%)
45%
50 (2%)
28 (2%)
56%
FIC
51 (3%)
23 (4%)
45%
0 (0%)
0 (0%)
0%
0 (0%)
0 (0%)
0%
NIBIB
19 (1%)
6 (1%)
32%
10 (0%)
5 (0%)
50%
3 (0%)
1 (0%)
33%
NIEHS
11 (1%)
8 (1%)
73%
39 (1%)
19 (1%)
49%
18 (1%)
9 (1%)
50%
NHLBI
1,775 (23%)
836 (22%)
47%
437 (14%)
154 (12%)
35%
NCI
1,224 (16%)
387 (10%)
32%
239 (8%)
72 (6%)
30%
NINDS
887 (11%)
455 (12%)
51%
217 (7%)
88 (7%)
41%
NIAID
849 (11%)
529 (14%)
62%
200 (6%)
101 (8%)
51%
NICHD
374 (5%)
180 (5%)
48%
229 (7%)
82 (7%)
36%
NIA
286 (4%)
124 (3%)
43%
194 (6%)
65 (5%)
34%
NIDCD
164 (2%)
89 (2%)
54%
49 (2%)
20 (2%)
41%
NEI
109 (1%)
77 (2%)
71%
45 (1%)
27 (2%)
60%
NIDCR
85 (1%)
42 (1%)
49%
53 (2%)
23 (2%)
43%
NIGMS
72 (1%)
45 (1%)
63%
12 (0%)
8 (1%)
67%
NCCAM
8 (0%)
6 (0%)
75%
44 (1%)
19 (2%)
43%
NINR
6 (0%)
4 (0%)
67%
27 (1%)
13 (1%)
48%
NCRR
0 (0%)
0 (0%)
0%
242 (8%)
140 (11%)
58%
NHGRI
0 (0%)
0 (0%)
0%
5 (0%)
0 (0%)
0%
Totals
1,513
(100%)
600
(100%)
40%
7,754
(100%)
3,751
(100%)
48%
3,083
(100%)
1,249
(100%)
41%
Source: IMPAC II
1.3.2 Distribution of Degrees among Applicants and Awardees
All K awards require applicants to have a doctoral-level degree; however, particular types of awards are targeted
to researchers with specific types of degrees. For example, the K08 and K23 programs are intended for clinician
scientists and patient-oriented researchers, respectively, and require applicants to hold an MD, MD/PhD, or other
health-professional doctoral degree.
Information regarding applicant degree(s) was derived from IMPAC II, and supplemented with additional data from
the Doctorate Records File (DRF) and Association of American Medical Colleges (AAMC) Faculty Roster when
necessary. Degrees were grouped into categories as described in Appendix III.
Reflecting the different eligibility requirements for the three K award programs, the distribution of applicant
degrees varied significantly, as shown in Figure 5. Overall, PhD recipients accounted for the majority (86.7
percent) of the K01 applicants, but were a smaller proportion of those applying for the K08 (2.8 percent) and K23

20
(17.3 percent) programs. Conversely, the K08 and K23 applicant pools were dominated by individuals with MDs,
(62.3 percent and 66.9 percent, respectively). Applicants with MD/PhD degrees accounted for 28.7 percent of K08
applicants, 7.8 percent of K01 applicants, and 11.9 percent of K23 applicants. The distribution of degree
qualifications for awardees from each of the programs corresponded to that of the applicants.
Figure 5. Degree distribution of applicants, by K activity
Source: Degree determined using IMPAC II and AAMC for all cases, and supplemented with DRF data for applicants with PhDs.
Applicants holding degrees other than PhD, MD, or MD/PhD represented 4.8 percent of the applicant pool as a
whole. Of these, nearly two-thirds held DVMs, with the DDS degree being the second-most represented “Other”
degree (22.9 percent). A similar pattern was seen among dual-degree holders, with DVM/PhD recipients
comprising 59.7 percent of the other dual-degree holders, followed by DDS/PhD recipients at 22.7 percent. DVM
and DVM/PhD recipients were largely concentrated in the K08 applicant pool, while individuals holding DDS or
DDS/PhD degrees were more equally distributed among the K08 and K23 applicant pools. Additional information
on the “Dual” and “Other” degree categories and their representation in the applicant pool is presented in
Appendix IV.
Though the absolute number of total applicants rose during the years covered by this evaluation, the distribution
of degree holders in the applicant pool was considerably different at the end of the study period than it had been
at the start. Over the years targeted by this evaluation, the numbers of PhD and MD/PhD recipients applying for
mentored K awards grew much more than the number of MD recipients and, as a result, the proportion of MD
recipients in the applicant pool decreased significantly for all three programs: from 8.2 percent to 3.3 percent for
K01 awards (p<0.05), from 82.3 percent to 53.8 percent for K08 awards (p<0.01), and from 73.4 percent to 65.4
percent for K23 awards (p<0.05). In the K01 applicant pool, the decline in the share of MD recipients was
accompanied by modest increases in the proportions of both PhD and MD/PhD recipients. Among applicants for
the K08 award, however, there was a significant increase in the proportion of MD/PhD recipients (15.0 percent to
36.0 percent, p<0.01), and in the applicant pool for K23 awards there was a significant increase in PhD recipients
(10.5 percent to 20.0 percent, p<0.01).
21
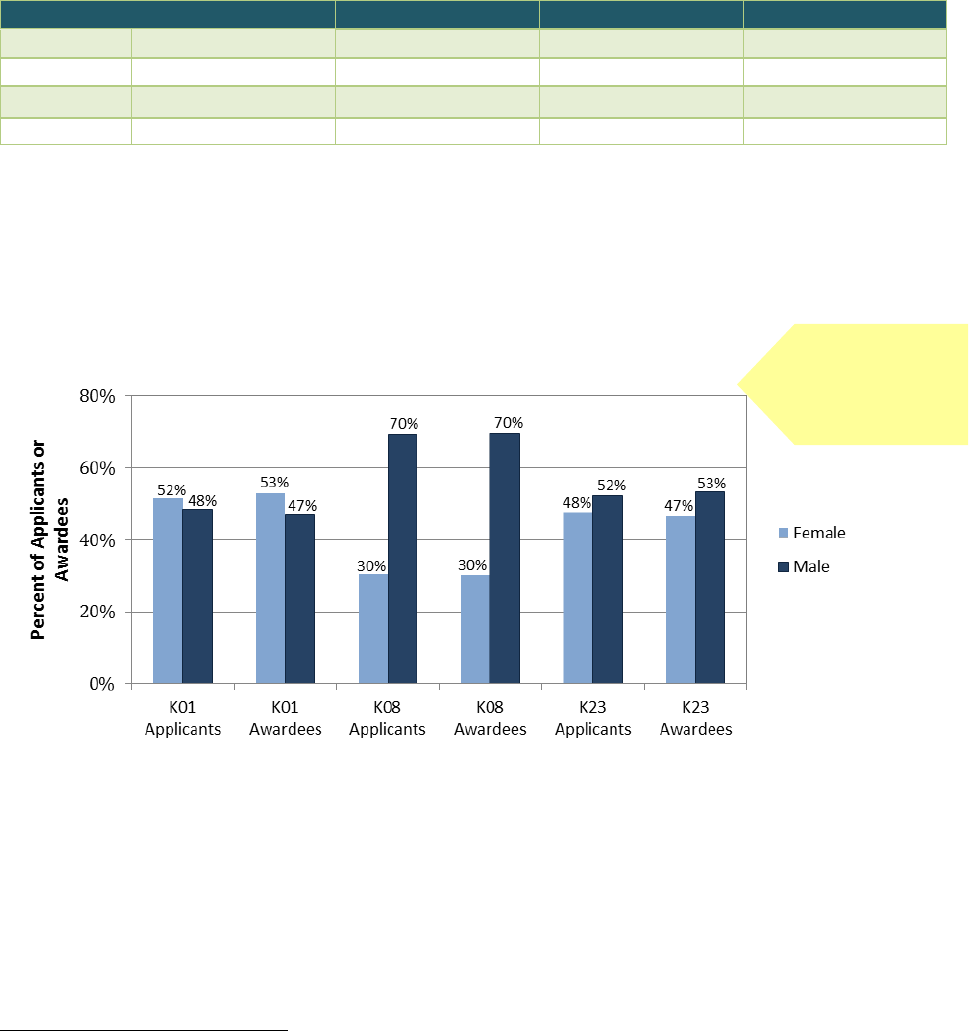
1.3.3 Sex Distribution among Applicants and Awardees
In our review of the sex distribution of career development applicants and awardees, we observed notable
differences by type of K activity.
10
As shown in Table 4, more than twice as many men than women (p<0.01)
applied for K08 awards. In contrast, applicants for K01 and K23 awards were evenly distributed.
Table 4. Comparison of applications, by sex
Sex
K01
K08
K23
Total
Male
706
47%
5,212
67%
1,555
50%
7,473
60%
Female
772
51%
2,305
30%
1,436
47%
4,513
37%
Unreported
1
35
2%
237
3%
92
3%
364
3%
Total
1,513
100%
7,754
100%
3,083
100%
12,350
100%
1
Includes applications for which this field was null, withheld, or missing.
Source: Determined first by IMPAC II data, then supplemented with information from the DRF, then AAMC.
For all three activities, the distribution of awards by sex was commensurate with the pattern of applicants (Figure
6).
Figure 6. Sex distribution of applicants and awardees
Source: Determined first by IMPAC II data, then supplemented with information from the DRF, then AAMC.
Because the K08 applicants and awardees included in this evaluation were drawn from a much longer time period
than those for the K01 or K23 programs, we also examined whether the proportion of women applying for K08
awards has changed over time. As shown in Figure 7, the proportion of women applying for K08 awards increased
modestly from FY1990 to FY2005, but at the end of that period, male K08 applicants still outnumbered females
two to one.
10
Here and throughout the analysis, we use either the Chi-Square test (for sex) or the two-proportion z-test (multi-
category analyses) to determine whether differences observed in the number of applications or awards (or
applicants and awardees) for two categories of variables were statistically significant.
Award rates were
commensurate with
application rates by
sex.

22
Figure 7. Sex distribution of K08 applicants
Source: Determined first by IMPAC II data, then supplemented with information from the DRF, then AAMC.
The discrepancy in the proportion of men and women applicants for K08 awards program may be due to the
degree distribution among applicants, which is skewed toward MD/PhD (see Figure 5). Although the numbers of
women pursuing MD/PhD training is increasing, their representation in dual-degree programs remains less than in
the medical student population as a whole. In 2008, just over a third (33.6 percent) of medical school graduates
with dual degrees were women.
11
This observation prompted further exploration of the relationships between degree type and sex for participants in
all three K programs. As shown in Figure 8, a smaller percentage of women K08 and K23 recipients held MD or
MD/PhD degrees than men, while more female K01 awardees (p<0.01) and K23 awardees (p<0.01) held PhDs.
This, taken with the observation that the proportion of MD/PhDs among K08 awardees is much higher than for the
other two activities, supports the hypothesis that the sex differences among applicants for K08 awards reflects the
degrees held by applicants.
11
Association for American Medical Colleges (2010). MD-PhD Applicants, Acceptees, Matriculants, and Graduates
of U.S. Medical Schools by Sex, 1999-2009. AAMC: Washington DC. Accessed from
https://www.aamc.org/download/161868/data/table32-mdphd99-10-web.pdf.pdf on December 6, 2010.
Consistently lower
numbers of women
applied to the K08
program.

23
Figure 8. Degree distribution of awardees by sex, by K activity
Source: Sex determined first by IMPAC II data, then supplemented with information from the DRF, then AAMC. Degree
determined using IMPAC II and AAMC for all cases, and supplemented with DRF data for applicants with PhDs.
1.3.4 Applications and Awards by Race/Ethnicity
Because race and ethnicity are voluntarily self-reported, and may not be consistently provided, we used a
combination of sources to obtain and verify the racial and ethnic characteristics of applicants for career
development awards. Data were obtained first from IMPAC II, and then supplemented as needed from the DRF
and the AAMC Faculty Roster. Even utilizing multiple data sources for this information, the percentage of
unknown race/ethnicity for applicants and awardees was almost 10 percent for applicants and almost 5 percent
for awardees. Racial and ethnic groups were reported as the mutually exclusive categories presented in Table 5
below. The category “Other” reflects applicants who listed more than one race/ethnicity or listed races/ethnicities
not included in the study categories. The “Unknown/Unreported” category was used for applicants who did not
report race or ethnicity.
Across all of the K activities, Hispanics accounted for 3.4 percent of applicants, Blacks 2.6 percent, Asians 14.8
percent, Native Americans 0.3 percent, Whites 68.1 percent, others 1.0 percent, and unknown 9.8 percent. By
comparison, during the years 1985 - 2000, Hispanics represented 4.9 percent of MD and PhD degree recipients,
Blacks 4.9 percent, Asians 13.5 percent, Native Americans 0.4 percent, Whites 73.2 percent, and other/unknown
2.6 percent.
12
When compared to this national pool of MD and PhD graduates during a similar time period, the
mentored K applicant pool exhibited small but significant differences in its racial and ethnic composition (p<0.05)
suggesting that these programs may have recruited fewer underrepresented minority applicants than available.
13
12
Association for American Medical Colleges (2008). Diversity in Medical Education: Facts & Figures 2008. AAMC:
Washington DC; National Science Foundation (2010) Survey of Earned Doctorates/Doctorate Records File. NSF:
Washington DC, accessed through WebCaspar (webcaspar.nsf.gov). Race/Ethnicity data from AAMC on U.S.
Medical School graduates from 1985-2000 were combined with Race/Ethnicity data from NSF on U.S. doctorates in
Biological Sciences, Medical Sciences, Other Life Sciences and Psychology awarded from 1985-2000.
13
This difference remained significant even after excluding the “unknown” groups from analysis.

24
By contrast, the mentored K award programs drew more Asian applicants than might have been expected in
comparison to the national pool.
Because the evaluation excluded ICs with K01 programs targeted to diversity
14
– and the proportion of applicants
of unknown race/ethnicity was greater than that of the Hispanic, African American, and Native American
applicants combined – it is impossible to know whether these findings reflect the true nature of the mentored K
applicant pool. Nonetheless, they suggest a need for further analysis and monitoring.
Table 5. Race/Ethnicity of K program applicants
Race/Ethnicity
1
K01
2
K08
K23
Total
Native American
8
0.7%
15
0.3%
5
0.2%
28
0.3%
Hispanic
43
3.7%
185
3.1%
93
4.1%
321
3.4%
Asian
3
212
18.4%
881
14.7%
294
12.9%
1,387
14.8%
Black
51
4.4%
120
2.0%
74
3.3%
245
2.6%
White
712
61.9%
4,213
70.4%
1,474
64.9%
6,399
68.1%
Other
4
4
0.3%
58
1.0%
35
1.5%
97
1.0%
Unknown/Unreported
120
10.4%
510
8.5%
296
13.0%
926
9.8%
Total Applicants
1,150
100%
5,982
100%
2,271
100%
9,403
100%
1
Race/Ethnicity categories are mutually exclusive.
2
ICs that specifically use this activity for diversity initiatives were excluded from this study.
3
Includes Native Hawaiian or Pacific Islander.
4
Includes more than one race or races not listed.
Source: Determined first by IMPAC II data, then supplemented with information from the DRF, then AAMC.
As the applicant pool for each of the three career development activities differs by sex, it also varies by
race/ethnicity, particularly for the K08 award (see Table 5). Like women, underrepresented minorities are less
likely to be found among the ranks of MD/PhD recipients that make up a large proportion of the K08 applicant
pool.
15
While interpreting these results is complicated by the unexpected proportions of individuals of unknown
race/ethnicity, there were no statistical differences between the proportion of applications from
underrepresented minorities and awards to individuals from those groups, as shown in Figure 9. Though the
award rate for those of Unknown race/ethnicity appears less than that of other groups, it is likely an artifact of
reporting: NIH awardees are more likely to have subsequent interactions with the agency than unsuccessful
applicants, and thus additional opportunities to provide their demographic information, thereby diminishing the
number of individuals of unknown race/ethnicity in the awardee pool.
14
ICs with K01 programs targeted at increasing minority participation were excluded from this study (see above,
“Study Sample”, page 14), which may have affected the race/ethnicity composition of the applicant pool.
15
Andriole DA, Whelan AJ, Jeffe DB. Characteristics and Career Intentions of the Emerging MD/PhD Workforce.
JAMA. 2008; 300(10):1165-1173.

25
Figure 9. Race/Ethnicity distribution of applicants and awardees
Source: Determined first by IMPAC II data, then supplemented with information from the DRF, then AAMC.
1.3.5 Scientific Specialty of Applicants
To determine whether there were any notable differences in the distribution of applicants by scientific fields, we
reviewed the PhD disciplines
16
and medical school departments of K award applicants. Tables 6 - 8 show the
leading fields of study and departments for mentored K applicants, as available for those individuals who also
appeared in the DRF and AAMC records.
As shown in Table 6, the most common PhD fields of study for K01 applicants corresponded to the predominant
fields among U.S. PhD graduates in the biological and behavioral sciences from 1996 - 2005: clinical psychology,
neuroscience, and biochemistry.
17
Although the number of PhDs applying for K08 and K23 awards was
comparatively small, the leading PhD disciplines among K08 and K23 applicants also reflected trends among recent
PhD recipients, with biochemistry and neuroscience ranking in the top five fields identified by applicants for each
(see Tables 7 and 8). In the case of K08 applicants, however, other common disciplines included basic biomedical
fields such as molecular biology, immunology, and physiology. Among PhD applicants for the K23 award, the
foremost field of study, by far, was clinical psychology (39.6 percent); other common disciplines reflected the
nature of patient-oriented research, and included nursing and epidemiology.
Also shown in Tables 6 - 8 are the most common medical school departments in which MD applicants held faculty
appointments.
18
The majority (>70 percent) of MD applicants
19
for mentored K awards held appointments in
departments of internal medicine, pediatrics, psychiatry, and surgery, reflecting the distribution of the medical
16
Data available for applicants who received a PhD from a U.S. university and were captured in the Doctorate
Record File. Includes PhDs and other dual-degree applicants holding PhDs, including MD/PhDs.
17
National Science Foundation, Division of Science Resource Statistics. December 2006, NSF07-305 S&E Doctorate
Awards: 2005. See http://www.nsf.gov/statistics/nsf07305/
18
Data available for applicants who received a MD from a U.S. university and were captured in the AAMC file.
Includes MD applicants and other dual-degree applicants holding MDs, including MD/PhDs.
19
Figure reflects MD applicants matched to AAMC records for all K awards.

26
school faculty as a whole.
20
MD applicants for K08 and K23 awards, in particular, tended to be concentrated in
departments of internal medicine.
Table 6. Top fields of study and departments for K01 Applicants (FY2000 – FY2005)
PhD Specialty
Department/Subunit of Medical School Appointment
Field of Study
PhD
Applicants
(% of Full
Cohort)
PhD
Applicants
(% of
Matched
Cohort)
Medical School
Department
MD Applicants
(% of Full
Cohort)
MD
Applicants
(% of
Matched
Cohort
Clinical Psychology
74 (6.4%)
9.5%
Psychiatry
177 (15.4%)
28.7%
Neuroscience
73 (6.3%)
9.4%
Medicine
169 (14.7%)
27.4%
Biochemistry
65 (5.7%)
8.4%
Pediatrics
67 (5.8%)
10.9%
Molecular Biology
43 (3.7%)
5.5%
Other Basic Sciences
46 (4.0%)
7.5%
Pharmacology
30 (2.6%)
3.9%
Biochemistry
31 (2.7%)
5.0%
Total Applicants
Matched to DRF Data
1
778
Total Applicants
Matched to AAMC Data
2
616
1
DRF specialty field data for PhD applicants available for 68 percent (778/1,150) of the K01 cohort.
2
AAMC medical school department data for MD applicants represents 54 percent (616/1,150) of the K01 cohort.
Note: MD/PhD applicants are represented in both PhD Specialty and Department/Subunit of Medical School Appointment.
Table 7. Top fields of study and departments for K08 Applicants (FY1990 – FY2005)
PhD Specialty
Department/Subunit of Medical School Appointment
Field of Study
PhD
Applicants
(% of Full
Cohort)
PhD
Applicants
(% of
Matched
Cohort)
Medical School
Department
MD
Applicants
(% of Full
Cohort)
MD
Applicants
(% of
Matched
Cohort)
Neuroscience
171 (2.9%)
11.3%
Medicine
2,101 (35.1%)
44.9%
Biochemistry
169 (2.8%)
11.2%
Pediatrics
919 (15.4%)
19.6%
Molecular Biology
151 (2.5%)
10.0%
Neurology
464 (7.8%)
9.9%
Immunology
117 (2.0%)
7.7%
Surgery
423 (7.1%)
9.0%
Physiology
97 (1.6%)
6.4%
Psychiatry
252 (4.2%)
5.4%
Total Applicants
Matched to DRF Data
1
1,513
Total Applicants
Matched to AAMC Data
2
4,681
1
DRF specialty field data for PhD applicants available for 25 percent (1,513/5982) of the K08 cohort.
2
AAMC medical school department data for MD applicants represents 78 percent (4,681/5982) of the K08 cohort.
Note: MD/PhD applicants are represented in both PhD Specialty and Department/Subunit of Medical School Appointment.
20
Association for American Medical Colleges (2008). AAMC Data Book: Medical Schools and Teaching Hospitals by
the Numbers, Table C2. AAMC: Washington DC.

27
Table 8. Top fields of study and departments for K23 Applicants (FY2000 – FY2005)
PhD Specialty
Department/Subunit of Medical School Appointment
Field of Study
PhD
Applicants
(% of Full
Cohort)
PhD
Applicants
(% of
Matched
Cohort)
Medical School
Department
MD
Applicants
(% of Full
Cohort)
MD
Applicants
(% of
Matched
Cohort)
Clinical Psychology
197 (8.7%)
39.6%
Medicine
741 (32.6%)
42.7%
Neuroscience
29 (1.3%)
5.8%
Psychiatry
377 (16.6%)
21.7%
Nursing Science
22 (1.0%)
4.4%
Pediatrics
316 (13.9%)
18.2%
Biochemistry
18 (0.8%)
3.6%
Neurology
134 (5.9%)
7.7%
Epidemiology
15 (0.7%)
3.0%
Surgery
50 (2.2%)
2.9%
Total Applicants
Matched to DRF Data
1
497
Total Applicants
Matched to AAMC Data
2
1,737
1
DRF specialty field data for PhD applicants available for 22 percent (497/2,271) of the K23 cohort.
2
AAMC medical school department data for MD applicants represents 76 percent (1,737/2,271) of the K23 cohort.
Note: MD/PhD applicants are represented in both PhD Specialty and Department/Subunit of Medical School Appointment.
To determine whether the introduction of the K23 award in 1999 drew individuals who might have previously
applied for a K08 award, we examined whether there were differences in PhD fields and medical school
departments of K08 applicants before and after 1999, and identified none.
1.3.6 Applicant Age and Average Years since Terminal Degree
The K activities examined in this study are intended to foster early-career researchers. As illustrated in Table 9, the
median age for the applicants was 37 years, consistent with the fact that the programs are targeted to
postdoctoral researchers and post-residency clinicians.
Table 9. Age of applicant
K01
K08
K23
Median Age
37.0
36.0
37.0
Average Age
37.7
36.8
38.3
Standard Deviation
5.3
4.0
5.4
Source: Due to the quality of data, determined first by AAMC data, then supplemented with information data from IMPAC II,
then DRF.
The K01 applicants were recent degree recipients,
21
primarily between three to five years post degree (Figure 10).
In contrast, K08 and K23 applicants were typically between seven to nine years post degree, reflecting
21
Data on the number of years since terminal degree was unavailable for a small percentage of the applicants. Values were
calculated using degree date from DRF or AAMC databases and year of application. For MD/PhD and other dual degree
applicants, the calculation was made using the degree most recently obtained.

28
requirements for residency and specialty training for clinicians. For applicants holding dual degrees, time from
degree was calculated from the date of the latest degree.
Although the absolute difference was small, the K23 program had twice as many applicants who were more than
15 years past their degree than the K08 program. More so than other fields of biomedical research, clinical
experience can be advantageous in patient-oriented research and may allow clinicians to enter research later in
their careers.
Figure 10. Years since terminal degree, by activity
Source: Determined using IMPAC II and AAMC for all cases, and supplemented with DRF data for applicants with PhDs.
The typical number of years since degree for each program corresponds to the prevalent degree type for each type
of mentored K award (Figures 10 and 11): PhD applicants seeking K01 awards typically apply three to five years
after receiving their degrees, while MD and MD/PhD applicants tend to apply seven to nine years following their
degrees. As shown in Figure 11, the highest percentage of applications from other dual degree candidates is seen
at zero years from degree. A large portion of these applicants are veterinarians or dentists applying for K awards
prior to the receipt of their doctorate (see Appendix IV), highlighting the different routes that these professionals
take to careers in research.
Figure 11. Years since terminal degree, by degree type
Source: Determined using IMPAC II and AAMC for all cases, and supplemented with DRF data for applicants with PhDs.
K01 applicants typically
applied three to five years
after terminal degree while
K08 and K23 applicants
tended to apply seven to
nine years after terminal
degree.

29
We also considered the relationship between sex and time from degree (see Figure 12). Overall, 37 percent of
mentored K applications in our study were submitted by women. Higher percentages of women applied in the first
three years following receipt of their degrees, consistent with the finding that women were more highly
represented among PhD and other dual degree holders. Women were also proportionally more likely to be in the
group of applicants 15 or more years since degree, which may reflect the demand of family responsibilities in the
years following the completion of their clinical training or differences in clinical and specialty fields among men and
women.
Figure 12. Years since terminal degree, by sex
Source: Sex determined first by IMPAC II data, then supplemented with information from the DRF, then AAMC. Degree
determined using IMPAC II and AAMC for all cases, and supplemented with DRF data for applicants with PhDs.
1.3.7 Prior Support of Applicants and Awardees
As detailed in Tables 10-11, the majority of mentored K applicants had prior NIH support, generally from a
research training grant (as a trainee) or fellowship, though on occasion as a PD/PI of a research grant.
22
For the
total number of individuals in each group with prior support, and other details, see Appendix VII. As might be
expected, applicants with prior NIH funding, either as a PI or a trainee, were more highly represented among K
awardees than in the full applicant pool (p<0.01).
22
Prior support included only NIH funding received by an applicant prior to their earliest application to the K programs included
in this study.

30
Table 10. Prior NIH traineeship (T), fellowship (F), and loan repayment (L) support (Percent of cohort)
Activity
(number in each group)
Prior T Support
Prior F Support
Prior T or F Support
Prior L Support
Applicant
s
Awardee
s
Applicant
s
Awardee
s
Applicant
s
Awardee
s
Applicant
s
Awardee
s
K01
Appl: n = 1,150
Awardees: n = 600
48%
53%
22%
26%
57%
63%
2%
3%
K08
Appl: n = 5,982
Awardees: n = 3,745
40%
43%
10%
11%
47%
51%
1%
1%
K23
Appl: n = 2,271
Awardees: n = 1,248
40%
44%
6%
7%
43%
47%
6%
4%
Total
Appl: n = 9,403
Awardees: n = 5,593
41%
44%
11%
12%
47%
51%
3%
2%
Note: Applicants who fit the criteria for more than one category are counted multiple times
Source: IMPAC II
Table 11. All prior NIH support (Percent of cohort)
Activity
Any
Prior Support
Prior Research (R) Support
23
Prior Eligible
Research (R) and Program
Project (P) Support
Applicants
Awardees
Applicants
Awardees
Applicants
Awardees
K01
Appl: n = 1,150
Awardees: n = 600
63%
70%
11%
13%
7%
4%
K08
Appl: n = 5,982
Awardees: n = 3,745
49%
53%
4%
4%
1%
1%
K23
Appl: n = 2,271
Awardees: n = 1,248
52%
55%
17%
15%
4%
2%
Total
Appl: n = 9,403
Awardees: n = 5,593
52%
55%
8%
7%
3%
2%
Note: Applicants who fit the criteria for more than one category are counted multiple times.
Source: IMPAC II
As institutional training grants are NIH’s largest research training program, a majority of the applicants with prior
support were former trainees on these awards. In performing this analysis, we found 21, 26, and 19 awardees in
the K01, K08, and K23 programs respectively had prior R or P support that should have rendered them ineligible for
the K award. While these numbers are small, they do highlight a potential need for increased oversight.
23
Prior Research Support specifically excludes grants of type T, F, K, A (traineeship activity used historically) and the following
activities: D15, D29.

31
Summary of Findings
Program and Participant Characteristics
Degree Type Distribution Among Applicants
Consistent with the goals of the specific K activities assessed, most applicants to the K01 program were PhD
recipients, while most applicants to the K08 and K23 programs were MD and MD/PhD recipients.
While the absolute number of applicants of all major degree types increased over the period of study, there
was a decline in the proportion of MDs in the applicant pool and an increase in the proportion of MD/PhDs
and PhDs.
There was no significant difference in K award rate by degree type.
Sex Distribution Among Applicants
K01 and K23 applicants were evenly distributed by sex.
For the K08 program, males consistently accounted for more than two-thirds of the applicant pool during
the 15-year study period.
Overall, more female applicants held PhDs, and more male applicants held MDs or MD/PhDs.
There was no significant difference in K award rate by sex.
Applications and Awards by Race/Ethnicity
The K applicants differed in race/ethnicity from PhD and medical school graduating classes from comparable
years, with disproportionately fewer Hispanics, Blacks, and Native Americans and more Asians applying for
these awards.
There was no difference in K award rate by race/ethnicity.
Applicant Scientific or Medical Specialty
The fields of training for PhD applicants reflected overall trends in U.S. PhD production, with psychology,
biochemistry, and neuroscience being the most common fields of study.
Among MD applicants with medical school faculty appointments, departmental representation paralleled
that of the faculty as a whole, with most holding appointments in departments of internal medicine,
pediatrics, psychiatry, and surgery.
Age of Applicants and Years Since Terminal Degree
The median applicant age was 37 years.
K01 applicants were typically three to five years past their terminal degree, while K08 and K23 applicants
were generally seven to nine years beyond their terminal degrees, reflecting the years of post-degree
clinical training undertaken by most clinician scientists and patient-oriented researchers.
There were small, but notable, numbers of applicants 15 or more years from degree, particularly for the K23
award.
Prior NIH Support
For all K activities, the majority of applicants had prior NIH traineeship or fellowship support.

32
PART II: SELECTED OUTCOMES
2.1 Overview
In this section, we describe our methods and present findings on the impact of K program participation on
applicant career outcomes. We focused on the scientific goals of mentored K awards: publications, grant
applications and awards, time to receipt of first R01, and faculty rank and progression, and retention in research.
For publications analysis, we measured publication and citation counts and journal impact factor.
2.2 Outcome Analysis Methodology
2.2.1 Deriving Comparison Cohorts
Multivariate models were used to create matched groups of funded and unfunded applicants for each K award to
measure program impact. Using a regression discontinuity design based on priority score – an NIH-wide
quantitative metric of application quality – applicants with an equal chance of being funded were identified and
then divided into funded and unfunded groups, based on the outcome of their applications. Restricting the
outcome analysis to funded and unfunded applicants with similar scores allowed us to examine the program’s
effects. This concept is illustrated in Figure 13.
Figure 13. Outcome analysis methodology: The “funding bubble”
For each K activity, we identified several funding bubbles, by IC, by fiscal year, for the date ranges of interest. Each
bubble was created by generating a set of candidate priority score ranges around the funding line (e.g. 165-194,
138-187, 177-201) that contained an equal number of funded and unfunded applications. To determine a unique
bubble for each K program, IC, and fiscal year, we ranked each bubble’s application density through a process
described in Appendix I.A.1.3. The unique bubble for each K program, IC, and fiscal year was selected from the
bubbles with the highest density rank, by using the following preferred criteria, in the order listed:
Highest score range upper endpoint (closest to 500)
The Priority Score “bubble”
represents a group of
applicants with similar priority
scores and thereby a similar
probability of funding

33
Minimum score range width (maximum allowed is 50 points)
Maximum application count (minimum allowed is four applications)
Lowest score range low endpoint (closest to 100)
Figure 14 depicts the general methodology.
Figure 14. Identifying comparable applicants and composing a funding bubble
2.2.2 Data Sources for Outcomes Analysis
Although successful careers may take any number of forms, the measures assessed in this evaluation focus on the
scientific goals of mentored K awards: (1) subsequent publication productivity and impact; (2) involvement in
subsequent NIH grants as a member of a research team, applicant, or principal investigator; (3) progression in an
academic career; (4) time to subsequent R01 award; (5) subsequent R01 and RPG success rates; and (6) duration in
the NIH funded research workforce.
Publications that matched author name and email information from IMPAC II were retrieved from the National
Library of Medicine MEDLINE databases. To reduce the possibility of erroneously assigned publications, we
employed a conservative matching algorithm that favored accuracy over inclusion and that used additional
information such as email address and co-author names to eliminate false matches. Journal impact factor and
times cited information were derived from the Thomson Reuters Web of Science Journal Citation Reports and
Science Citation Index. Faculty rank progression information was obtained from the AAMC Faculty Roster file for
those applicants with faculty appointments at medical schools. Finally, we used IMPAC II to collect NIH grant
applications and awards for all analyses of involvement in subsequent NIH grants.

34
2.3 Composition of the Study Cohorts
2.3.1 Activities, ICs, and Fiscal Years
K program bubble cohorts were combined for all ICs and presented by fiscal year, as shown in Table 12. The
average size of each fiscal year cohort for the K01, K08, and K23 programs was 45, 59, and 63 applicants,
respectively. Each applicant had exactly one application within the cohort. Separately, we combined the K program
bubble cohorts for all fiscal years and examined the distribution by IC, as shown in Table 13. The most highly
represented ICs within the cohorts were NIDDK, NHLBI, NCI and NIMH. Those ICs with too few K applicants and
awardees or that otherwise did not meet the requirements of the bubble design were not included in the analysis
(NIEHS, NINR, NIDCD, and FIC).
Table 12. Applicants in each bubble cohort, by fiscal year
K01
K08
K23
FY2005
116
204
178
FY2004
60
86
98
FY2003
22
64
42
FY2002
20
42
32
FY2001
22
44
18
FY2000
28
54
12
FY1999
*
46
*
FY1998
*
58
*
FY1997
*
52
*
FY1996
*
60
*
FY1995
*
54
*
FY1994
*
56
*
FY1993
*
42
*
FY1992
*
28
*
FY1991
*
22
*
FY1990
*
24
*
Total
268
936
380
* Not included in study group.
Table 13. Applicants in each bubble cohort, by IC
IC
K01
K08
K23
NIAAA
8
-
-
NIAMS
46
42
10
NIDA
24
4
24
NIDDK
116
174
42
NIBIB
4
-
-
NIMH
70
38
50
NIA
*
30
24
NIAID
*
98
36
NCCAM
*
-
4
NCI
*
178
54
NIDCR
*
8
6
NEI
*
10
-
NIGMS
*
4
-
NICHD
*
44
30
NHLBI
*
218
40
NINDS
*
88
22
NCRR
*
-
38
Total
268
936
380
* Not included in study group.
- ICs where no bubble cohort could be generated.

36
2.3.2 Demographic Distribution
To control the number of external factors affecting outcomes of K awardees, we tested for demographic
differences between the funded and unfunded cohorts (Table 14). We found that a greater proportion of K08
funded applicants had prior NIH training or research support than unfunded applicants (p<0.05). Therefore,
outcomes that favor K08 funded applicants should also take into consideration the likely positive effects of
previous NIH support. No other differences were found, indicating that comparisons are between largely
equivalent groups.
Table 14. Demographic characteristics of K program bubbles
Parameter
Category
K01
Funded
K01
Unfunded
K08
Funded
K08
Unfunded
K23
Funded
K23
Unfunded
Sex
Female
53.4%
47.2%
30.9%
31.7%
43.4%
47.3%
Male
46.6%
52.8%
69.1%
68.3%
56.6%
52.7%
Degree
Type
MD
3.0%
3.0%
65.4%
63.8%
66.8%
68.5%
PhD
86.6%
83.6%
1.3%
2.4%
15.8%
12.6%
MD/PHD
7.5%
11.9%
27.8%
27.0%
14.7%
15.8%
Dual
3.0%
1.5%
1.7%
2.4%
1.6%
0.5%
Other
0.0%
0.0%
3.8%
4.4%
1.1%
2.6%
Years Since
Degree
0-5 yrs
57.5%
48.7%
17.3%
15.0%
17.7%
17.0%
6-11 yrs
35.8%
41.3%
66.8%
62.6%
56.8%
52.0%
>12 yrs
6.7%
10.0%
15.9%
22.4%
25.5%
31.0%
Prior NIH
Support
With Prior
Support
69.9%
66.7%
62.3%
52.5%
62.7%
67.4%
Bold font is used to highlight differences that are significant at p<0.05.
Source: Sex determined first by IMPAC II data, then supplemented with information from the DRF, then AAMC. Degree
determined using IMPAC II and AAMC for all cases, and supplemented with DRF data for applicants with PhD degrees.
2.4 Publications and Citations
2.4.1 Publication Outcomes
To assess research output, we compared the publications of applicants in the matched funded and unfunded
cohorts. For each successful application, publications were captured in MEDLINE from the fiscal year after the
application through FY2009. (See Appendix I.A.1.5 for a detailed description of our methodology.)
As shown in Table 15, all three groups of K awardees were significantly more likely to have subsequent
publications than matched unfunded applicants (p<0.01). The differences between K08 and K23 awardees and
their unfunded counterparts were particularly striking: 32 percent more K08 awardees and 20 percent more K23
awardees were authors (i.e. they had at least one subsequent publication). K01 recipients were 16 percent more
likely to author at least one publication than their unfunded K01 counterparts. Citation and impact factor analyses
yielded more mixed results, perhaps because individuals in the funded and unfunded cohorts were of relatively
similar ability levels.

37
Nonetheless, the finding that K awardees were significantly more likely to have subsequent publications than their
unfunded counterparts suggests that the NIH mentored career development award program is successfully
retaining early-stage investigators in research careers. This appears to be the case particularly for clinician
scientists and patient-oriented researchers in the K08 and K23 pools.
Table 15. Applicant publication outcomes
Funding Status
Total K
Applicant
Authors
Total
Publications
Average
Publications
per Author
Average Impact
Factor per
Publication
Average
Times
Cited
K01
(FY2000 –
FY2005)
Funded (n=134)
118 (88%)
884
7.49
4.9
13.6
Unfunded (n=134)
96 (72%)
682
7.1
4.8
13.8
K08
(FY1990 –
FY2005)
Funded (n=468)
393 (84%)
4,886
12.43
4.9
21.3
Unfunded (n=468)
244 (52%)
2,797
11.46
5.1
22.2
K23
(FY2000 –
FY2005)
Funded (n=190)
177 (93%)
1,845
10.42
4.7
10.4
Unfunded (n=190)
139 (73%)
1,164
8.37
4.4
11.4
Bold font is used to highlight differences that are significant at p<0.05. Bold Italics font used to highlight differences that are
significant at p<0.01.
Source: MEDLINE matched to PI records in IMPAC II.
2.5 Subsequent Participation in NIH Grant Programs
Using NIH IMPAC II records, we compared subsequent NIH applications and awards of mentored K awardees and
their unfunded counterparts, and explored demographic and educational differences.
2.5.1 Composite Cohort Outcomes
In Figure 15, we contrast the frequency with which funded and unfunded cohorts of mentored K awards applied
for and received subsequent R01 awards,
24
other RPG awards,
25
and non-RPG awards or subprojects,
26
or served in
other non-PI research roles on NIH grants.
27
24
The calculation of award and application percentages for subsequent outcomes included Type 1, 2, and 5 grants.
25
RPG awards that were observed included (in order of prevalence): R01, R21, P01, R03, U01, R29, U19, R34, R56,
R37, R33, R55, DP1, DP2, R15, P42, UC7, UC1, R35.
26
Non-RPG awards that were observed included (in order of prevalence): M01, P50, P30, K23, P20, U10, T32, Z01,
P41, K24, K01, K02, P60, K08, R25, RC1, R13, K07, K22, K11, I01, P51, S10, R44, R49, P40, R43, RC2, K26, U54, SC1,
R41, N01, ZIA, U79, U24, U49, D43, F37, A11, G12, G13, F32, K12, R24, S15,T37, U13, U18.
27
Individuals were identified as key personnel on research project grants active in FY2006 or FY2007.

38
Figure 15. Subsequent NIH grant outcomes, by K program
Source: IMPAC II
For all three types of mentored career development awards, the funded applicant cohort had a higher rate of
subsequent NIH grant applications than matched unfunded applicants (p<0.01). Overall NIH award rates were also
significantly higher for the K08 and K23 awardees (but not K01 recipients) when compared to their respective
unfunded counterparts (p<0.05).
The effect of the career development award was particularly striking among K08 awardees, where the percentage
of individuals who received R01 and other RPG awards was twice that of the unfunded applicants (42 percent
versus 21 percent; p<0.01). While the most common type of subsequent NIH award for individuals in the K01 and
K08 cohorts was an R01, those in the K23 pool were more likely to direct center grants or subprojects and other
non-RPG awards, reflecting the different patterns of support for patient-oriented research.
For all three types of mentored K awards, the percentage of unfunded applicants with no subsequent interactions
with the NIH was at least twice as high as the percentage of funded applicants, suggesting that they may not have
remained in research careers. The percentage of applicants with “no subsequent NIH activity” was particularly high
for unsuccessful K08 and K23 applicants when compared to their funded counterparts (p<0.01).

39
2.5.2 Subsequent NIH Applications and Awards by Sex
As illustrated in Figure 16, there were differences between female and male K01 and K23 recipients in the
likelihood of applications for subsequent NIH grants, but no such discrepancies were seen among the cohort of K08
awardees. It is possible that these observations reflect differences in length of follow-up: the earliest K01 and K23
awardees included in this evaluation were from FY2000, while the earliest K08 awardees received their awards in
FY1990. Since previous analyses of NIH K08 awardees have shown that women progress from K awards to
research awards more slowly than men, at least in the beginning of their careers,
28
it is possible that the
differences observed here in subsequent NIH applications from male and female K01 and K23 awardees will
diminish over time.
Figure 16. Percentage of funded applicants with subsequent RPG applications, by sex
Source: Sex determined first by IMPAC II data, then supplemented with information from the DRF, then AAMC. Grant activity
determined using IMPAC II.
Our analysis of subsequent NIH grant activity was further refined by exploring differences for each type of K award
by sex. As shown in Figures 17-19, both male and female K awardees outperformed their unfunded counterparts in
almost every measure. Subsequent grant outcomes, by sex, for the full population of applicants to each K activity
are described in Appendix IX.
28
Pohlhaus, JR, Jiang, H, Sutton, J. Sex Differences in Career Development Awardees’ Subsequent Grant Attainment. Annals of
Internal Medicine. 2010, 152(9): 616-17.
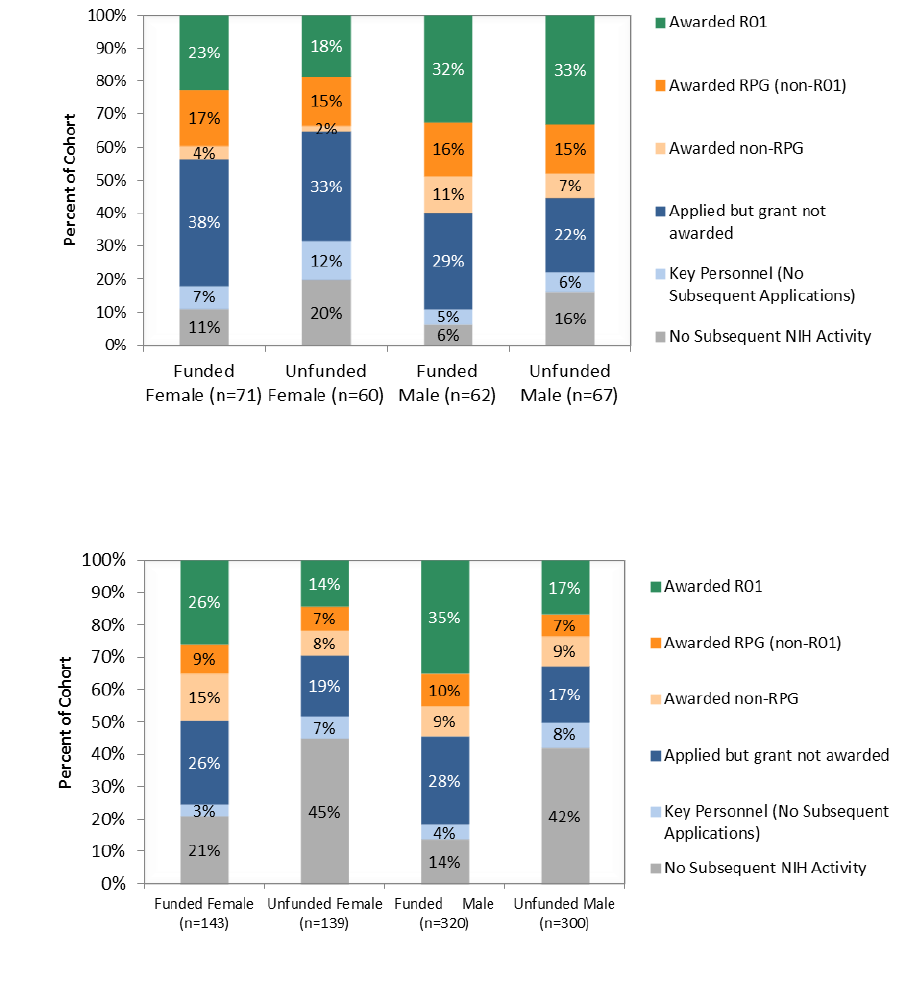
40
Figure 17. K01 applicant grant outcomes, by sex
Source: Sex determined first by IMPAC II data, then supplemented with information from the DRF, then AAMC. Grant activity
determined using IMPAC II.
Figure 18. K08 applicant grant outcomes, by sex
Source: Sex determined first by IMPAC II data, then supplemented with information from the DRF, then AAMC. Grant activity
determined using IMPAC II.

41
Figure 19. K23 applicant grant outcomes, by sex
Source: Sex determined first by IMPAC II data, then supplemented with information from the DRF, then AAMC. Grant activity
determined using IMPAC II.
2.5.3 Subsequent Grant Applications and Awards by Degree
We also analyzed the effect of an applicant’s doctoral training on subsequent grant involvement, focusing on the
major degree types (i.e., PhDs, MD/PhDs, MDs), and comparing K awardees (Figure 20) to unfunded K applicants
(Figure 21). Among all degree types, K awardees were significantly more likely to apply for R01 awards (p<0.05)
than their unfunded matched counterparts. This difference was particularly pronounced among MDs receiving
K08 and K23 awards, who were more than twice as likely to apply for subsequent R01 awards as their unfunded
counterparts.

42
Figure 20. Percentage of funded applicants with subsequent RPG applications, by degree
29
Source: Degree determined using IMPAC II and AAMC for all cases, and supplemented with DRF data for applicants with PhDs.
Grant activity determined using IMPAC II.
Figure 21. Percentage of unfunded applicants with subsequent RPG applications, by degree
29
Source: Degree determined using IMPAC II and AAMC for all cases, and supplemented with DRF data for applicants with PhDs.
Grant activity determined using IMPAC II.
The trends observed in subsequent NIH grant application rates for individuals of different degree types were also
evident for awards, though less pronounced for PhD applicants than for MD and MD/PhD applicants. For example,
while K01 awardees holding PhDs were more likely to apply for subsequent R01 awards (p<0.05), the difference
between their R01 award rate and that of their unfunded counterparts was not significant (Figure 22).
29
All of the differences seen in the applications from K08 and K23 applicants and awardees between Figures 20
and 21 were found to be significant (p<0.05). For the K01 awardees, the only significant difference was in the
frequency of applications for subsequent R01 awards (p<0.05).

43
Figure 22. K01 applicant grant outcomes, by degree
Source: Degree determined using IMPAC II and AAMC for all cases, and supplemented with DRF data for applicants with PhDs.
Grant activity determined using IMPAC II.
As shown in Figure 23,
30
K08 awardees with MDs and MD/PhDs fared better in subsequent grant outcomes than
their matched unfunded cohorts. Both MD and MD/PhD K08 awardees significantly outperformed unfunded
applicants in terms of overall NIH activity (p<0.05). The difference was particularly noticeable among MDs applying
for R01 awards, where K08 awardees were more than twice as likely to be successful as their unfunded
counterparts (p<0.01).
Figure 23. K08 applicant grant outcomes, by degree
Source: Degree determined using IMPAC II and AAMC for all cases, and supplemented with DRF data for applicants with PhDs.
Grant activity determined using IMPAC II.
30
In Figures 23 - 24, degree types with fewer than 50 applicants were excluded from the comparison analysis.

44
Differences among MD applicants for K23 awards were similarly striking. As shown in Figure 24, those who
received K23 awards were significantly more likely to have subsequent NIH grant activity (p<0.01) and to have
received R01 awards (p<0.01). Subsequent grant outcomes, by degree, for the full population of applicants to
each K activity are described in Appendix X.
Figure 24. K23 applicant grant outcomes, by degree
Source: Degree determined using IMPAC II and AAMC for all cases, and supplemented with DRF data for applicants with PhDs.
Grant activity determined using IMPAC II.
2.5.4 Subsequent Awards by IC
Many NIH Institutes and Centers that support mentored career development awards are interested in retaining K
awardees within their own pool of investigators. We explored whether mentored K recipients routinely receive
subsequent research support from the same ICs that sponsored their career development awards, but found no
clear effect. Analysis of subsequent grant application patterns suggests that K awardees initially seek funding from
the same ICs that provided their career development support, but that this tendency diminishes as their track
record of NIH applications grows. (See Appendix XI for further details.)
2.6 Medical School Faculty Rank Progression
To examine whether receipt of a K award affected an applicant’s progression through the faculty ranks, we
identified individuals within unfunded and funded cohorts from each activity that reported more than one
appointment in the AAMC Faculty Roster database, which includes information on faculty at U.S. medical schools.
Overall, 30 percent (478/1,584) of the matched cohorts were identified in the AAMC Faculty Roster as holding at
least two distinct successive appointments at a participating medical school; of those, 68 percent held MDs, 22
percent held MD/PhDs, 9 percent held PhDs, and 1 percent held other combinations of dual degrees.

45
As shown in Table 16, we found no significant differences between funded and unfunded cohorts in the average
time for promotion to a position of higher faculty rank for any of the three K mechanisms evaluated. The
percentage of applicants that appeared in the AAMC Faculty Roster may have been too low to identify any
significant differences between the two cohorts; for K01 and K23 applicants, in particular, the time period for
follow-up may also have been too short.
Table 16. Applicant faculty progression outcomes
Awarded
Average Years to
Next Position
K01
1
Y (n = 25)
5.4
N (n = 16)
5.4
K08
2
Y (n = 195)
7.4
N (n = 141)
7.9
K23
3
Y (n = 51)
5.7
N (n = 50)
5.7
1
K01: 41 Applicants out of 268 in the K01 Bubble Cohort had position history data in AAMC (15 percent)
2
K08: 336 Applicants out of 936 in the K08 Bubble Cohort had position history data in AAMC (36 percent)
3
K23: 101 Applicants out of 380 in the K23 Bubble Cohort had position history data in AAMC (27 percent)
Source: AAMC Faculty Roster File
2.7 Does Participation in Mentored K Programs Delay the Start of Independent
Research Careers?
Because mentored K awards are targeted to individuals near the start of their independent careers, some
observers have raised the question of whether the receipt of a K award might divert or unduly delay the careers of
awardees. To explore that question in more detail, we compared the length of time between the initial K
application and subsequent R01 and other RPG applications and awards for our two matched cohorts of
applicants.
The average times to R01 and other RPG (non-R01) applications and awards are shown in Tables 17 and 18,
below.
31
There were no substantial differences in time to R01 application or award between the funded and
unfunded applicants for K08 and K23 awards; however, unsuccessful K01 applicants who went on to apply for R01
awards did so a year earlier than K01 awardees. This difference between the K01 and other career development
award applicants is almost certainly related to the high concentration of PhDs in the K01 pool, who are likely to be
more prepared – and perhaps have greater incentive – to apply for an R01 without further career development.
31
Time to R01/RPG is measured from the researcher’s first K application within the time frame of this study to
their first R01 application/award.

46
Table 17. Average time to R01 application for K applicant cohorts
Activity/
Award Status
Average Years to
First R01
Application
Average Years to
First R01 Award
Average Age at
First R01 Award
K01 Funded (n=134)
4.2
4.9*
41.8*
K01 Unfunded (n=134)
3.1
3.9*
39.6*
K08 Funded (n=468)
4.9
6.0
41.5
K08 Unfunded (n=468)
4.6
6.2
42.7
K23 Funded (n=190)
4.4
4.4
40.9
K23 Unfunded (n=190)
4.2
4.0
40.1
Bold font is used to highlight differences that are significant at p<0.05.
*Sample size is too small to perform significance tests.
Note: “First R01 Application” and “First R01 Award” refer to the first application and award after the last K application within
this study.
Source: IMPAC II
As for applications for other RPGs (Table 18), unfunded applicants for the K01, K08, and K23 awards all apply for
awards other than R01 awards significantly sooner than the K awardees. This might be due in part to unfunded K
applicants seeking support through small (R03) or exploratory (R21) grant programs that provide funds for
preliminary studies and data collection.
Table 18. Average time to RPG (non-R01) application for K applicant cohorts
Activity and
Award Status
Average Years to
First RPG
Application
Average Years to
First RPG Award
Average Age at
First RPG Award
K01 Funded (n=134)
3.9
4.4*
40.6*
K01 Unfunded (n=134)
3.3
3.3*
40.2*
K08 Funded (n=468)
5.2
5.9
41.4
K08 Unfunded (n=468)
4.3
4.9
41.5
K23 Funded (n=190)
4.2
4.0*
40.9*
K23 Unfunded (n=190)
3.3
3.8*
39.5*
Bold font is used to highlight differences that are significant at p<0.05.
*Sample size is too small to perform significance tests.
Notes: “First RPG Application” and “First RPG Award ” refer to the first application and award after the last K application within
this study. In this table RPG refers to all RPGs except the R01.
Source: IMPAC II
The somewhat shorter times to RPG application and award for K01 and K23 awardees compared to the K08 cohort
may reflect the effect of recent NIH policies to encourage applications from newly-trained investigators. To

47
facilitate the transition of all mentored career award recipients to independent NIH research support, NIH
modified its policies early in FY2004, permitting K awardees to draw concurrent support from research awards.
32
In a related policy change implemented in early FY2009, NIH began to encourage early transition to research
independence by identifying applications from early-stage investigators (new investigators within ten years of
completing their terminal research degree or completing their medical residency) and considering the career stage
of the applicant both in the course of review and at the time of award.
33
The timing of these policy changes,
however, came too late to benefit K08 awardees in the 1990s, and may account for longer times to application and
award for R01 and other RPG awards among the K08 cohort as a whole.
2.8 Does Participation in K Programs Generally Increase R01 & RPG Success Rates?
To gain a better understanding of the effect of the career development experience on subsequent R01 grant
success, we also compared the R01 success rates for NIH applicants who never sought mentored career
development awards with those of K01, K08, and K23 awardees (Table 19). For ease of analysis, we examined new
(Type 1) R01 grant applications from FY1990 - FY2009 (378,609 grant applications) and calculated a cumulative
success rate. Overall, the cumulative R01 success rate (total awarded grants/total grant applications) during this
time period was 18.7 percent. We found that applications from researchers who held a prior K01, K08, or K23
award had a significantly higher success rate (p<0.01) than those from individuals with no prior career
development support. Because K awardees are more likely to be in the early stages of their careers, we also
compared their success rates to new investigators
34
who had not had the benefit of a career development award
and found even greater differences (p<0.01).
Table 19. NIH-wide new R01 success rates of mentored K awardees and other investigators (FY1990 - FY2009)
Total R01
Applications
1
R01 Applications
from
K01, K08 and K23
Awardees
2
R01 Applications
from Investigators
with No Prior K
Applications
3
R01 Applications
from New
Investigators with
No Prior K
Applications
Applications
378,609
15,950
300,397
130,104
Awards
70,943
3,129
54,874
20,560
Success Rate
4
18.7%
19.6%
18.3%
15.8%
1
Includes new (Type 1) R01 applications received between FY1990 - FY2009
2
Includes all in-study K awardees, not restricted to the Bubble Cohorts
3
Includes PIs with no prior K application of any kind
4
All differences were found to be significant (p<0.01)
Source: IMPAC II
32
National Institutes of Health. Mentored Career Development Awards: Change in NIH Policy Concerning
Concurrent Support from Career Development Award and a Research Grant [NOT-OD-04-007]. Released November
14, 2003. http://grants.nih.gov/grants/guide/notice-files/not-od-04-007.html (Accessed December 29, 2010).
33
National Institutes of Health. Encouraging Early Transition to Research Independence: Modifying the NIH New
Investigator Policy to Identify Early Stage Investigators [NOT-OD-08-121]. Released September 26, 2008.
http://grants.nih.gov/grants/guide/notice-files/not-od-08-121.html (Accessed December 29, 2010).
34
“New Investigators” definition was used from
http://grants.nih.gov/grants/new_investigators/index.htm (Accessed June 15, 2010). Researchers with prior
grants of the following types were still considered New Investigators: R00, R03, R13, R15, R21, R25, R90, RL5, R34,
R36, R41, R43, R55, R56, SC2, SC3, X01, F awards, K awards, L30, L32, L40, L50, L60, T32, T34, T35, T90, D43, G07,
G08, G11, G13, G20, S10, S15, S21, S22.

48
Using the same approach, we also compared the cumulative RPG success rates for various groups, and again,
applications from those with prior K01, K08, or K23 support were successful at significantly higher rates than those
from investigators with no previous K support, and especially those from new investigators (Table 20).
Table 20. NIH-wide new RPG success rates of mentored K awardees and other investigators (FY1990 - FY2009)
Total RPG
Applications
1
RPG Applications
from
K01, K08 and K23
Awardees
2
RPG Applications
from Investigators
with No Prior K
3
RPG Applications
from
New Investigators
with no Prior K
Applications
Applications
577,785
24,648
466,962
242,609
Awards
115,521
5,304
91,248
42,652
Success Rate
4
20.0%
21.5%
19.5%
17.6%
1
Includes new (Type 1) RPG applications received between FY1990 - FY2009
2
Includes all in-study K awardees, not restricted to the Bubble Cohorts
3
Includes PIs with no prior K application of any kind
4
All differences were found to be significant (p<0.01)
Source: IMPAC II
2.9 Does Participation in K Programs Increase the Duration of Research Careers?
We used two proxy measures to evaluate the impact of a career development award on the length of a recipient’s
subsequent research career: the percentage of subsequent years in which the applicants received any NIH
research funding, and the application and success rates for subsequent RPG renewal funding. To allow an
adequate time period for follow up, our analysis was limited to the subset of K08 applicants in the study group
who applied for the K award between FY1990 - FY2000. K applicants were only included if their last K application in
the study (or continuation of that application) was completed prior to FY2001.
For each applicant, we examined all grants received between FY2001 - FY2009, and determined the percentage of
funded years during this nine-year period following their participation in the K program.
35
As shown in Table 21,
K08 recipients had a higher percentage of years with NIH support following their K awards, both with any NIH
funding and with RPG funding, compared to unfunded K08 applicants (p<0.05). K awardees most frequently
secured R01 funding (42.5 percent of subsequent grants) and support from General Clinical Research Center (M01)
subprojects (18.9 percent).
36
35
“Percent Years with any NIH Funding” is calculated as the number of years with a funded Type 1, 2 or 5 grant divided by nine
years for the FY2001 - FY2009 period studied here. K applicants were only included if their last in-study K application (or
continuation of that application) was completed prior to FY2001.
36
The top five sources of subsequent funding for K08 applicants included in the FY1990 - FY2000 study group were R01 (42.5%),
M01 (18.9%), R21 (5.4%), P01 (4.5%) and P50 (3.3%).

49
Table 21. Percent RPG and overall funded years for K08 applicants
Cohort
(FY1990 - FY2000)
Percent Years with
Any NIH Funding,
FY2001 – FY2009
Percent Years with
NIH RPG Funding,
FY2001 – FY2009
Funded K08 (n=168)
34.9%
25.9%
Unfunded K08 (n=248)
15.1%
11.0%
Source: IMPAC II
Successful continuation of a research project beyond the initial grant period is a major milestone in maintaining a
research career and provides tangible recognition of an investigator’s accomplishments and track record of
success. Therefore, higher application and success rates for renewal (Type 2) grant applications serve as additional
indicators of accomplished and long-lasting research careers. In Figure 25, we present application and success
rates for renewal (Type 2) grant applications for funded and unfunded K08 applicants. K08 recipients have higher
Type 2 application rates than their counterparts during a similar time period (p<0.01) – particularly for R01 awards
– as well as a higher rate of achieving at least one renewal (Type 2) award (p<0.05).
Figure 25. Subsequent renewal (Type 2) grant application and success rates (K08 FY1990 - FY2000 cohort)
Source: IMPAC II

50
Summary of Findings
Selected Participant Outcomes
Overall, mentored career awards appeared to retain participating investigators in research careers
and contribute to their subsequent research success:
o K awardees were significantly more likely to have subsequent research publications than
comparable unfunded applicants.
o K awardees were more likely than comparable unfunded applicants to apply for
subsequent NIH research awards.
o Among those who could be followed for at least a decade, K awardees had a higher
percentage of years with subsequent NIH support and were more likely to apply for and
receive at least one competitive renewal of an R01 grant than comparable unfunded
applicants.
o Collectively, researchers who had held a prior K01, K08, or K23 award had a significantly
higher R01 award success rate than the pool of individuals with no prior career
development support.
Among various types of K awardees, there were differences in the impact of career development
support:
o K08 and K23 recipients applied for and received R01 awards within the same time period
as their comparable unfunded counterparts, but K01 awardees were likely to apply for
R01 awards later than the comparison group of unfunded applicants.
o K08 and K23 awardees had significantly higher rates of receiving subsequent NIH
research awards than a matched group of unfunded applicants, but there were no
significant differences between K01 awardees and unsuccessful applicants.
o Male K01 and K23 awardees were more likely to apply for and receive subsequent R01
and RPG awards than their female counterparts. Among K08 awardees, who were
followed for longer periods of time, there were no differences between men and women
in subsequent applicants or awards.
o K awards appeared to have the greatest impact on the subsequent NIH research
involvement of MD recipients, followed by MD/PhD recipients, and then PhD recipients.

51
PART III: SUMMARY AND POLICY IMPLICATIONS
3.1 Mentored K Evaluation Conclusions
In general, we found that NIH’s program of individual mentored career development awards is reaching its
intended audience of early career doctorates and improving their potential to launch and sustain independent
research careers. Using matched cohorts of funded and unfunded program applicants, we were able to isolate the
impact of program participation, and determined that:
Receipt of an individual mentored career development award had a measurable and significant impact on
program participants, as seen in their publication records and subsequent applications for and receipt of
NIH grants.
With the exception of K01 recipients, who are primarily PhDs, participation in a mentored career
development program did not delay the start of an independent career.
Collectively, researchers who participated in these programs had a significantly higher R01 success rate
than those with no prior career development support.
For those participants who could be followed for a sufficiently long period of time, participation in the
mentored K program resulted in more subsequent NIH research support and more NIH research project
renewals.
This evaluation also detected a number of potentially important differences in participation in career development
programs and in the ensuing benefits:
The number of applications from Blacks, Hispanics, and Native Americans was somewhat lower than
might be expected from their representation among graduates of U.S. medical schools and biomedical
and behavioral PhD programs.
K01 awardees took a year longer to apply for an R01 than comparable unfunded applicants, but there was
no such difference between K08 and K23 recipients and the comparison group of applicants for those
awards.
When K awardees were followed for ten years or less, male K awardees applied for and received
subsequent NIH grants at higher rates than their female counterparts. Among the cohort of K awardees
evaluated for more than 10 years, however, there were no differences in the subsequent research
outcomes of male and female K awardees.
3.2 Policy Implications
Though its mission has remained the same – to foster the development of biomedical scientists at crucial points in
their careers – the NIH career development program today is far different than when it started more than fifty
years ago. To respond to changing needs of the workforce, some types of awards have been modified or

52
eliminated and others have been added. Furthermore, over the time period covered by this evaluation, there
were a number of additional changes that affected the mentored career development programs and pools of
participants under assessment. In addition, and not insignificantly, faculty hiring for tenure-track positions in both
clinical and basic science departments has not increased significantly over the time of this study, presenting a
challenge to individuals launching independent research careers and seeking NIH grant support.
The first major change to the career development program during the time period covered by our evaluation was
the launch of the K23 award in 1999. After its introduction, MD applicants interested in patient-oriented and
clinical research were directed to the K23 program, and the pool of applicants for the K08 award became
increasingly focused on laboratory-based research.
Another development during this period was the small, but gradually increasing number of NIH ICs supporting new
investigators – primarily PhD recipients – through career development “transition” (K22) awards. The introduction
of this new model of career development in 1998 was intended to provide postdoctoral researchers a more direct
route to faculty positions and the funding to help establish their own independent research programs.
In late 2003, NIH also modified its funding policies to ease the transition of K awardees to independent research
support by allowing mentored career development recipients to draw salary support from a research grant or
other qualifying award if they were successful in obtaining funding in the final two years of career development
support.
37
These trends posed challenges for evaluation, and undoubtedly affected our findings. The K08 applicants and
awardees from FY1990 - FY1999 had somewhat different characteristics than those from FY2000 - FY2005. At the
same time, the increasing focus on “transition” awards for PhDs in the early 2000s likely drew the attention of new
investigators who otherwise might have pursued K01 awards. Finally, though adopted late in the time period
covered by our evaluation, it appears that the NIH policy for concurrent support of K awardees may have played a
role in reducing the time to subsequent independent research support.
Moreover, changes in the NIH career development program and policies for new investigators are continuing. In
FY2006, NIH introduced both the K99/R00 Pathway to Independence transition award and the Clinical and
Translational Science Award (CTSA) program of institutional career development awards. Since then, applications
for individual K01, K08, and K23 awards have all declined. Perhaps contributing to this decline, NIH has also
provided incentives to encourage new investigators to seek R01 research grant support within ten years of their
degrees.
38
As NIH career development programs continue to evolve, the findings of this evaluation raise a number of
questions for further consideration and discussion by NIH and its partners:
What is the best form of career development for PhD recipients who have had substantial research
training and career development in the course of earning their research doctoral degrees? When
37
National Institutes of Health. Mentored Career Development Awards: Change in NIH Policy Concerning
Concurrent Support from Career Development Award and a Research Grant [NOT-OD-04-007]. Released November
14, 2003. http://grants.nih.gov/grants/guide/notice-files/not-od-04-007.html (Accessed December 29, 2010).
38
National Institutes of Health. Encouraging Early Transition to Research Independence: Modifying the NIH New
Investigator Policy to Identify Early Stage Investigators [NOT-OD-08-121]. Released September 26, 2008.
http://grants.nih.gov/grants/guide/notice-files/not-od-08-121.html (Accessed December 29, 2010).

53
considered in conjunction with the positive outcomes reported for the earliest career transition
awardees,
39
the finding that PhD recipients do not benefit from traditional mentored K awards as much
as clinician researchers suggests that NIH should consider whether transition awards may be a more
optimal model of career development support for PhD holders.
What are the best ways to attract under-represented minority researchers to biomedical research
careers? Applications to K programs from Blacks, Hispanics, and Native Americans were somewhat lower
than might be expected from their representation among graduates of U.S. medical and biomedical and
behavioral doctorate programs, suggesting that a closer look at the mentored K programs, particularly
those targeted at improving diversity in the research workforce, is merited.
Is NIH doing all it can to ensure the success of women investigators? Though it is encouraging to find
that there are no differences in the long-term research success of male and female K08 awardees, the
differences between the short-term outcomes of male and female K01 and K23 awardees suggest a need
for further discussion about how to optimize the career development of female investigators.
Should NIH be more receptive to mid-career investigators turning to patient-oriented research after
developing their clinical expertise? The identification of a cohort of K23 applicants more than fifteen
years from degree highlights the differences between the typical career paths of clinical and research
doctorates, and raises questions about whether NIH’s traditional focus on fostering the training and
career development of individuals early in their careers may be inadvertently narrowing the pool of
potential patient-oriented investigators.
39
“Evaluation of the K22 Program: Key Findings” NIH Training Advisory Committee (TAC) Presentation. October 10,
2007.

54
Appendix I: Data Selection Methods
A.1.1. Determination of Application Pool
A.1.1.a. Demographics analysis
The universe of IMPAC II application records for purposes of the demographic analysis is defined as those meeting
the following criteria:
Activity
Code
From
To
Institutes and Centers (IMPAC II abbreviations)
K01
FY2000
FY2005
TW,AA,AR,EB,DA,DK,ES,MH
K08
FY1990
FY2005
All NIH ICs
40
K23
FY2000
FY2005
All NIH ICs
41
Note: Only Type 1 applications were considered.
For each IC, only one application per person and activity code was included in a given fiscal year. If multiple
applications were submitted by an individual to an IC within a given FY, only one for each IC in a given fiscal year
was included. The selection of which application to include was based on the following protocol that lists tie-
breaking rules in decreasing precedence:
1. Include the awarded application.
42
2. Include the application with the highest suffix code (A1, A2, etc.).
3. Include the application with the latest council meeting date.
4. Include the application with the latest status date.
5. Include the application with the most recent received date.
6. Include the application with the highest and therefore most recent historical grant number in IMPACII.
An application was considered “awarded” if its application status code was either ‘03’ (Award Terminated) or ‘05’
(Awarded). All other status codes were considered “not awarded.”
For those activities for which all NIH ICs were to be included, determination of eligible ICs was made by
examination of the “PHS_Org_Code” field. Only those applications with a PHS_Org_Code value corresponding to
an NIH IC (ICD_DHHS_Code = 1) were included.
A.1.1.b. Outcomes Analysis
Whereas the pool of applications for demographics was deliberately selected in a manner that would allow for
multiple applications (to different ICs or in different fiscal years) to be included for an individual, a slightly different
set of rules was used to determine the pool of applications suitable for outcome analysis. For outcome analysis,
we identified those individuals and applications (as a subset of those in the demographics population) across all K
activity codes who received a K award of some type, regardless of fiscal year. If the first awarded application fell
40
Although there were no restrictions, (a) some ICs did not have K08 Type 1 applications: HG, LM, MD, TW; and
(b) some ICs do not participate in any K programs: CL, CT, OD
41
ICs that did not have Type 1 K23 awards: TW
42
When there was more than one awarded application, the other listed tie-breakers were used.

55
within one of the three selected K activity codes and the fiscal year fell within the range for that activity code, it
was included.
Finally, we identified those individuals who never received a K award of any type. If these individuals had multiple
applications within the selected periods and activity codes, the most recent application with a non-null priority
score was included.
A.1.2. Methods Used for Determination of Demographics
A.1.2.a. Identification of IMPAC II Person Relevant Records
As a first step to determine the demographic distribution of applicants, we sought to uncover instances of multiple
IMPAC II profile records for a given applicant, so that we could make use of all available information concerning
sex, race/ethnicity, degrees, and prior NIH support (that may not all have been contained within a single profile).
To accomplish this, applicants were mapped to individuals defined in the Discovery Logic “People Database.” All
individuals either corresponded directly to a single IMPAC II profile, or were mapped to several duplicate profiles,
43
with the duplication detected by a complex algorithm.
A.1.2.b. Prior NIH Support
To identify prior NIH support for each applicant, we queried IMPAC II for records that met the following criteria:
1. The Application PI Profile ID or Person Involvements record with “TA” (training appointment), “PI”
(principal investigator, or “MPI” (multi-principal investigator) role type matched the K application records.
2. The application was not related to the K application, and
3. The application was from an earlier fiscal year than the K application, and
4. The application was awarded (defined by a status code of ‘05’, ‘06’, ’51’, ’52’, or ‘99’).
We also retrieved the SubProject_ID, if any, to help determine whether the applicant might have been listed as the
PI for a subproject within a program rather than as the PI for the overall program.
For traineeships, to determine whether support was provided at the pre-doc or post-doc level, we retrieved and
saved the Stipend_Degree_Level_Code. Because traineeships were often reported on paper (rather than
electronically) by the recipient institution in the decades preceding the study group, there is the possibility that an
individual within the study was a pre-doc or post-doc trainee, but this information was not recorded within IMPAC
II. Any error in prior traineeship support is therefore an underestimation; there is no evidence to suggest that this
underestimation would affect a particular group of applicants differently than any other group.
All information on prior NIH support was recorded in the K evaluation database for each individual.
43
As of April 2010, there were 9,374 individuals in the study; 172 individuals were linked to 352 IMPAC II profiles
by the People DB collapse algorithm (average = (2 profiles/Individual); max = 4).

56
A.1.2.c. Birth Date, Race/Ethnicity, and Sex
To derive an “IMPAC II” set of birth date, race/ethnicity, and sex attributes for each individual, we retrieved all the
IMPAC II profile and project person records and recorded the most frequent non-null values for each in the K
evaluation database, using the following additional specifications:
Birth dates were ignored if they were outside of the range January 1, 1920 to December 31, 1992. For
sex, the most frequent value of “M” (male) or “F” (female) for each individual was selected.
For race/ethnicity, the Race_Type_Code was matched to the IMPAC II Racial_Ethnic_Types_MV view. The
value observed most frequently for each individual within the Race_Type_Acronym /
Ethnicity_Type_Code of ‘H’ (Hispanic), ‘I’(Native American), ’P’ (Asian), ’A’ (Asian), ’B’ (Black), ’W’ (White),
’M’ (Other) was recorded as the race/ethnicity for each individual.
We then matched each applicant to records from AAMC and DRF using the AAMC_WSM_MATCHED and
DRF_MATCH tables (provided by the Data Quality Branch of the Division of Information Services, Office of Research
Information Systems in the NIH Office of Extramural Research), using IMPAC II Person_ID indicators. An attempt
was made to match every known IMPAC II person record for an individual to the other sources. From the matched
records, we derived a set of attributes for each individual that recorded race/ethnicity, sex, and birth date.
The following mapping was used to convert values in the DRF and AAMC files to the IMPAC II values for
race/ethnicity.
Data Source: Field
Value(s)
Corresponding IMPAC II Value
DRF: Race
1
Native American
DRF: Race
2, 3, 4
Asian
DRF: Race
5
Black
DRF: Race
4
Asian
DRF: Race
5
Black
DRF: Race
6, 7, 8, 9
Hispanic
DRF: Race
10
White
DRF: Race
11, 12
Other
AAMC: Race_Hisp_DMV
Cuban, Mexican American, Multiple
Hispanic, Other Hispanic, Puerto Rican
Hispanic
A set of rules was applied to each applicant to derive values for birth date, sex, race/ethnicity, and degree(s). For
birth date, the following rules were used in descending order:
1. Use AAMC birth date if available.
2. Use IMPAC II birth date if available.
3. Use DRF birth date if available, using first day of month.
For sex, these rules were applied in descending order:
1. Use IMPAC II sex if available.
2. Use DRF sex if available.

57
3. Use AAMC sex if available.
For race/ethnicity, the rules were applied in descending order:
1. Use IMPAC II race/ethnicity if available.
2. Use DRF race/ethnicity if available.
3. Use AAMC race/ethnicity if available.
A.1.2.d. Degree
Degree information (type of degree, year earned, and terminal degree year) was obtained from IMPAC II, AAMC,
and DRF. The possible degree types were classified into the following main categories:
Degree Category
(Code)
Description
Specific Degrees
M (MD)
A medical degree of the
listed type
BAO, BCH, BDSC, CHB, DO, MBBC, MBBCH, MBBCHB, MBBS,
MBCHB, MD, MDCM
P (PhD)
A doctoral degree of the
listed type
DMEDSC, DNS, DNSC, DPH, DPHIL, DRPH, DRSC, DSC, EDD, PHD,
SCD
MD/PhD
Has both an MD-category
and PhD-category degree
(and possibly others)
Example combinations:
MD and PhD and MS/BS
CHB and DPHIL
D (Dual)
Has either an MD-category
degree or a PhD-category
degree (but not both) and
at least one degree from
the Other category that is
marked as a “Dual
Qualifier”
44
Example combinations:
MD and PharmD
DNS and JD
O (Other)
A degree that is not an MD-
category or PhD-category
type or Note type, often in
a specialized area
BH, DC, DCLINP, DCLINPSY, DDOT, DDS, DH, DMD, DNSCCNM,
DOTH, DPHARM, DPM, DSN, DVM, FAAN, JD, JD1, LLD, MMED,
ND, OD, OTH, PHAR, PHARMD, PHM, PHMD, PSYD, RN, VDOT,
VMD
N (Note)
(Excluded)
Undergraduate or Masters-
level degree or technical
degree
115 Degree types -- examples include BPHARMACY, BS, BSC,
FRCS, GNP, HS, LCSW, MS, MBA, CM, SLP, SM, THM (full list in
Appendix III)
44
As of April 2010, all Other degree types were Dual Qualifiers except for FAAN, OTH, and RN.
58
Dual and Other degree categories were further sub-categorized depending on the specific combination of PhD,
MD, and Other degrees. The sub-categories are referred to as “Classifications” and are stored in the
DegreeClassification table in the K evaluation database. This sub-categorization process was carried out manually
with guidance from NIH program staff for the specific degree combinations that appeared in the data and was not
performed for all possible degree combinations. Finally, some synonymous degrees were standardized: DMD was
converted to DDS and VMD was converted to DVM.
Manual review revealed many cases of invalid degree records in all three data sources, with the most invalid
records found in IMPAC II. One example of an invalid degree was an MD or PhD degree appearing the IMPAC II
Person_Degs_T table, but not appearing in the individual’s Biosketch. When discovered, corrections for these
cases were applied to the AAMC and DRF views and to a local copy of the IMPAC II table, Person_Degs_T.
Degree data was not stored as an attribute of the applicant; instead, it was stored as an attribute of each
individual’s application, with the degree for a given application being the closest in time before or equal to the
application fiscal year.
A “terminal degree year” was derived for each individual based on the following rules in descending order of
precedence:
1. If an individual held an MD/PhD degree, the latest degree year for all known MD and PhD degrees (from
all sources) was used, or a null value was used if there was no degree year available.
2. If an individual held an MD degree, the latest MD degree year (from IMPAC II or AAMC sources) was used,
or a null value was used if there was no degree year available.
3. If an individual held a PhD degree, the latest PhD degree year (from all three sources) was used, or a null
value was used if there was no degree year available.
4. If an individual held an Other degree, the latest Other degree year (from IMPAC II or AAMC sources) was
used, or a null value was used if there was no degree year available.
5. If an individual held a non-doctoral degree, the latest non-doctoral degree year (from IMPAC II or AAMC
sources) was used, or a null value was used if there was no degree year available.
6. If an individual held a Dual degree (MD or PhD, along with a “Dual Qualifier” Other degree), the latest
degree year (from all sources) was used, or a null value was used if there was no degree year available.
A.1.2.e. Academic Rank
The academic rank for each applicant was determined if the applicant could be linked to AAMC records. Academic
rank was not stored as an attribute of the applicant; instead, it was stored as an attribute of each individual’s
application. Academic rank was determined as follows.
1. If the AAMC records contained appointment(s) that started before the application date, and ended after
the application date (or were still current), then we used the maximum rank associated with that set of
appointments as the academic rank for that application.
2. If the AAMC records showed that all appointments started and ended after the application date (which
would be a data anomaly), we did not apply an academic rank for that application.

59
3. If the AAMC records showed that all appointments started and ended before the application date, only
those appointments for which the end date was within one year of the application date were considered
valid. Of the appointments with valid end dates, we used the maximum rank associated with the set of
appointments that ended closest to the application date as the academic rank for that application. For
applicants that had only invalid appointments, we did not apply an academic rank for that application.
Those applicants who had two or more successive appointments were included in the analysis of academic rank
progression.
A.1.3. Methods Used to Identify Applications “On-The-Bubble”
To identify applications “on-the-bubble” for a given activity code, applications were grouped by IC and fiscal year.
Within each group, multiple clusters of scored applications were created according to the following protocol:
For each application, separate clusters were created that contained all other applications within the
following allowed ranges of priority scores: 5, 10, 15, 20, 25, 30, 35, 40, 45, and 50.
Clusters that contained fewer than four applications were discarded.
Clusters that were “unbalanced” were discarded, where unbalanced was defined by unequal numbers of
funded and unfunded applications.
Each remaining cluster was then considered a bubble candidate and rated on its suitability for use as a bubble
based on the following formula that defines “application density”:
= Count of awarded applications within cluster
= Count of non-awarded applications within cluster
= Difference between highest and lowest allowed score in the cluster (always a multiple of five)
This formula gives higher scores to clusters of higher application density. Then, clusters were sorted in descending
order of application density, with tiebreakers decided by the following priorities in decreasing order.
The cluster with the highest score-range upper endpoint (closest to 500)
The cluster with the smallest score-range width (; upper endpoint minus lower endpoint)
The cluster with the largest application count ( plus )
The cluster with the lowest score-range lower endpoint (closest to 100)
The highest ranking cluster within each activity code, IC, and fiscal year was then tagged as a bubble, and each
application within these clusters was marked as being on-the-bubble.

60
A.1.4. Determination of Subsequent NIH Activity
IMPAC II was queried for all grant application records (linked to each applicant in the study) that started within one
year after the last fiscal year of any of the K01, K08, or K23 applications in the study. All activities were captured
(RPG applications and awards as well as non-RPG applications and awards) and recorded as subsequent NIH
activity. In addition, all involvement roles (PI, Trainee, Government) were captured and recorded. Applications
that were found to be post-study continuations of in-study K awards were marked as “K Award Continuations” and
were excluded from reports showing future outcomes for study applicants.
A.1.5. Matching MEDLINE Publication Records to Applicants
Several independent but overlapping matching rules were used to identify MEDLINE publication records in which a
study applicant appeared as an author. To be considered for matching, the publication date had to be at least one
year after the application date of the last in-study K application for that applicant. The upper bound for the
publication date was December 31, 2009. The matching rules were complex; the summary below is a greatly
abbreviated version of the matching protocol.
1. Match publications for which there was an exact match of the MEDLINE author email address and the
IMPAC II PI email address, and a moderate-strength fuzzy name match between the MEDLINE author
name and the IMPAC II PI name.
2. Match publications for which there was an exact match of the MEDLINE author email address and the
IMPAC II PI email address, and a name match between any of the other MEDLINE author names and
the IMPAC II PI name.
3. Match publications for which there was an exact match of the Web of Science author email address
(for MEDLINE publications that have been matched to Web of Science) and the IMPAC II PI email
address, and a moderate-strength fuzzy name match between the MEDLINE author and the IMPAC II
PI name.
4. Using the set of matches found using the first three rules, find additional publications for which the
MEDLINE author names have high name-frequency-corrected overlap and a fuzzy name match
between the MEDLINE author name and the IMPAC II PI name.
The matching process was conservative, and favored accuracy over inclusion. Any limitations of this method
applied equally to all applicant groups.
About one percent of publications were manually checked for matching errors. Accuracy was defined by the
number of publications matched divided by the number of publications actually by the author, and was
determined to be 100 percent. Recall was defined by the number of publications matched divided by the number
of the author’s publications, and was determined to be 60 percent.

61
APPENDIX II: NIH Institute and Center (IC) Abbreviations
Shown in Table A2.1 are the Acronyms for NIH Institutes and Centers (IC) that are used in this report.
Table A2.1. NIH IC Acronyms
Acronym
Full IC Name
FIC
NCCAM
NCI
NCRR
NEI
NHGRI
NHLBI
NIA
NIAAA
NIAID
John E. Fogarty International Center for Advanced Study in the Health Sciences
National Center for Complementary and Alternative Medicine
National Cancer Institute
National Center for Research Resources
National Eye Institute
National Human Genome Research Institute
National Heart, Lung, and Blood Institute
National Institute on Aging
National Institute on Alcohol Abuse and Alcoholism
National Institute of Allergy and Infectious Diseases
NIAMS
National Institute of Arthritis and Musculoskeletal and Skin Diseases
NIBIB
NICHD
NIDA
NIDCD
National Institute of Biomedical Imaging and Bioengineering
Eunice Kennedy Shriver National Institute of Child Health & Human Development
National Institute on Drug Abuse
National Institute on Deafness and Other Communication Disorders
NIDCR
NIDDK
NIEHS
NIGMS
NIMH
NIMHD
NINR
NINDS
NLM
National Institute of Dental and Craniofacial Research
National Institute of Diabetes and Digestive and Kidney Diseases
National Institute of Environmental Health Sciences
National Institute of General Medical Sciences
National Institute of Mental Health
National Institute on Minority Health and Health Disparities
National Institute of Nursing Research
National Institute of Neurological Disorders and Stroke
National Library of Medicine

62
APPENDIX III: Applicant Degree Classification
The degrees held by K applicants were grouped into six categories to facilitate various cross-parameter analyses.
Non-doctoral degrees, registrations, and honorifics were excluded from this study.
Table A.3.1. Applicant Degree Classification
Degree
Category
Included Degrees
MD
BAO, BCH, BDSC, CHB, DO, MBBC, MBBCH, MBBCHB, MBBS, MBCHB, MD, MDCM
PhD
DMEDSC, DNS, DNSC, DPH, DPHIL, DRPH, DRSC, DSC, EDD, PhD, SCD
MD/PhD
Any combination of a degree in the MD category and a degree in the PhD category
Dual
Any MD or PhD degree, but not both, in conjunction with any degree from the Other degree
category except for FAAN, OTH, RN
Other
BH, DC, DCLINP, DCLINPSY, DDOT, DDS, DH, DMD, DNSCCNM, DOTH, DPHARM, DPM, DSN, DVM,
FAAN, JD, JD1, LLD, MMED, ND, OD, OTH, PHAR, PHARMD, PHM, PHMD, PSYD, RN, VDOT, VMD
Excluded
Degrees
AA, AACR, AB, AH, APRNBC, ARNP, ATC, BA, BAMD, BBA, BM, BMED, BOTH, BPHARMACY, BS,
BSC, BSCHONS, BSD, BSE, BSN, BSPHAR, CCCA, CCCSLP, CE, CERT, CERTIF, CFNP, CM, CNM, CP,
CRC, CS, DCH, DD, DDD, DGO, DIPACVS, DM, DMS, DRS, DTMH, EDM, EPI, FAAAAI, FAAP, FACC,
FACEP, FACOG, FACP, FACS, FAHA, FCCM, FNP, FRACP, FRCA, FRCDC, FRCP, FRCPI, FRCS, GNP, HS,
LCSW, LMT, LP, MA, MAS, MB, MBA, MBE, MCR, MDIV, MDOT, MED, MEE, MGS, MH, MHS,
MMSC, MOTH, MPA, MPE, MPH, MPHIL, MRCP, MRCPI, MS, MSC, MSCE, MSCI, MSCR, MSEE,
MSHS, MSN, MSP, MSPH, MSSA, MSURG, MSW, MTR, NULL, PAC, PH, PHDMAB, PHDRESP, PNP,
PT, RD, RNC, RPH, RVT, SCM, SLP, SM, THM, WHCNP

63
APPENDIX IV: Dual Degrees
Shown in Table A.4.1 are the degrees included in the Dual category, along with the frequency at which they were
represented in this study. Table A.4.2 shows the list of degrees included in the Other degree category. Dual and
Other degrees, combined, accounted for two percent, six percent, and four percent of K01, K08, and K23
applicants, respectively.
Table A.4.1. Dual doctorate degrees
Degree
Sub Category
Count
Percent
DVM/PhD
108
59.7%
DDS/PhD
41
22.7%
MD/DDS
9
5.0%
OD/PhD
8
4.4%
MD/DVM
4
2.2%
MD/JD
3
1.7%
MD/PharmD
2
1.1%
PharmD/PhD
2
1.1%
ND/PhD
1
0.6%
DC/PhD
1
0.6%
JD/PhD
1
0.6%
MD/DPM
1
0.6%
Table A.4.2. Other degrees
Degree
Sub Category
Count
Percent
DVM
163
61.3%
DDS
61
22.9%
OD
19
7.1%
PharmD
16
6.0%
PsyD
5
1.9%
ND
1
0.4%
DPM
1
0.4%

64
APPENDIX V: Doctorate Records File (DRF) Fields of Study
The DRF fields of study are shown below with the frequencies associated with K applicants in this study, listed in
descending order for each K activity.
K01 (n=1,130)
K08 (n=1,950)
K23 (n=685)
NEUROSCIENCE
8.9%
BIOCHEMISTRY
11.2%
CLINICAL
PSYCHOLOGY
40.9%
CLINICAL PSYCHOLOGY
8.8%
NEUROSCIENCE
10.6%
NEUROSCIENCE
5.1%
BIOCHEMISTRY
7.4%
MOLECULAR BIOLOGY
9.7%
NURSING SCIENCE
4.8%
NURSING SCIENCE
6.2%
IMMUNOLOGY
8.0%
BIOCHEMISTRY
3.2%
MOLECULAR BIOLOGY
4.6%
PHYSIOLOGY, HUMAN AND
ANIMAL
6.5%
EPIDEMIOLOGY
2.9%
PHARMACOLOGY,
HUMAN AND ANIMAL
3.8%
PHARMACOLOGY, HUMAN
AND ANIMAL
6.1%
PHARMACOLOGY,
HUMAN AND ANIMAL
2.6%
PHYSIOLOGY, HUMAN
AND ANIMAL
3.6%
CELL/CELLULAR BIOLOGY
AND HISTOLOGY
5.7%
PSYCHOLOGY,
GENERAL
2.3%
DEVELOPMENTAL AND
CHILD PSYCHOLOGY
2.8%
MICROBIOLOGY
4.4%
SPEECH-LANG.
PATHOLOGY AND
AUDIOLOGY
2.3%
EPIDEMIOLOGY
2.7%
PATHOLOGY, HUMAN AND
ANIMAL
4.1%
COUNSELING
PSYCHOLOGY
2.2%
NUTRITIONAL SCIENCES
2.7%
BIOLOGY/BIOLOGICAL
SCIENCES, GENERAL
3.6%
HEALTH SCIENCES,
OTHER
2.0%
PUBLIC HEALTH
2.4%
CLINICAL PSYCHOLOGY
3.5%
PHYSIOLOGY, HUMAN
AND ANIMAL
2.0%
EXPERIMENTAL
PSYCHOLOGY
2.3%
GENETICS, HUMAN AND
ANIMAL
2.6%
MICROBIOLOGY
1.9%
SOCIAL WORK
2.3%
BIOLOGY/BIOMEDICAL
SCI., OTHER
2.5%
NUTRITIONAL
SCIENCES
1.6%
PHYSIOLOGICAL/
PSYCHOBIOLOGY
2.1%
BIOPHYSICS
2.3%
MOLECULAR BIOLOGY
1.5%
PSYCHOLOGY, GENERAL
2.0%
ANATOMY
2.0%
SCHOOL PSYCHOLOGY
1.5%
CELL/CELLULAR BIOLOGY
AND HISTOLOGY
1.9%
SPEECH-LANG.
PATHOLOGY AND
AUDIOLOGY
1.7%
DEVELOPMENTAL
AND CHILD
PSYCHOLOGY
1.3%
SOCIAL PSYCHOLOGY
1.8%
DEVELOPMENTAL
BIOLOGY/EMBRYOLOGY
1.5%
PATHOLOGY, HUMAN
AND ANIMAL
1.3%
MICROBIOLOGY
1.6%
VETERINARY MEDICINE
1.2%
PHYSIOLOGICAL/
PSYCHOBIOLOGY
1.3%
BIOLOGY/BIOLOGICAL
SCIENCES, GENERAL
1.5%
BIOENGINEERING AND
BIOMEDICAL
1.1%
IMMUNOLOGY
1.2%
IMMUNOLOGY
1.5%
BIOMEDICAL SCIENCES
0.9%
PUBLIC HEALTH
1.2%

65
APPENDIX VI: Department/Subunit of Medical School Appointments
AAMC appointments are shown below with the frequencies associated with K applicants in this study, listed in
descending order for each K activity.
K01 (n=616)
K08 (n=4,681)
K23 (n=1,737)
PSYCHIATRY
28.7%
INTERNAL MEDICINE
44.9%
INTERNAL MEDICINE
42.7%
INTERNAL MEDICINE
27.4%
PEDIATRICS
19.6%
PSYCHIATRY
21.7%
PEDIATRICS
10.9%
NEUROLOGY
9.9%
PEDIATRICS
18.2%
OTHER BASIC SCIENCES
7.5%
SURGERY
9%
NEUROLOGY
7.7%
BIOCHEMISTRY
5%
PSYCHIATRY
5.4%
SURGERY
2.9%
PHARMACOLOGY
4.9%
PATHOLOGY (CLINICAL)
4.6%
OBSTETRICS & GYNECOLOGY
2.4%
PHYSIOLOGY
4.5%
PATHOLOGY (BASIC SCIENCE)
3.2%
FAMILY PRACTICE
2.1%
SURGERY
3.4%
OTHER BASIC SCIENCES
2.9%
ANESTHESIOLOGY
1.9%
ANATOMY
3.1%
ANESTHESIOLOGY
2.7%
PUBLIC HEALTH &
PREVENTIVE MEDICINE
1.8%
NEUROLOGY
2.8%
OBSTETRICS & GYNECOLOGY
2%
OTHER BASIC SCIENCES
1.6%
MICROBIOLOGY
2.8%
OTOLARYNGOLOGY
1.9%
RADIOLOGY
1.4%
PATHOLOGY (BASIC SCIENCE)
2.3%
MICROBIOLOGY
1.8%
OPHTHALMOLOGY
1.2%
DERMATOLOGY
2.3%
RADIOLOGY
1.7%
EMERGENCY MEDICINE
1.2%
PUBLIC HEALTH &
PREVENTIVE MEDICINE
2.3%
PHARMACOLOGY
1.7%
PHYSICAL MEDICINE &
REHABILITATION
0.9%
PATHOLOGY (CLINICAL)
1.9%
PHYSIOLOGY
1.6%
OTOLARYNGOLOGY
0.9%
RADIOLOGY
1.9%
BIOCHEMISTRY
1.6%
PATHOLOGY (BASIC SCIENCE)
0.5%
OBSTETRICS & GYNECOLOGY
1.5%
ANATOMY
1.5%
PATHOLOGY (CLINICAL)
0.4%
ANESTHESIOLOGY
1.1%
OPHTHALMOLOGY
1.5%
OTHER CLINICAL SCIENCES
0.4%
ORTHOPEDIC SURGERY
1.1%
DERMATOLOGY
1.2%
DERMATOLOGY
0.3%
FAMILY PRACTICE
1%
PUBLIC HEALTH &
PREVENTIVE MEDICINE
0.7%
ORTHOPEDIC SURGERY
0.3%
HOSPITALS LABS CLINICS
INSTITUTES
0.5%
OTHER CLINICAL SCIENCES
0.6%
PHARMACOLOGY
0.3%
OTOLARYNGOLOGY
0.3%
PHYSICAL MEDICINE &
REHABILITATION
0.5%
PHYSIOLOGY
0.3%
OPHTHALMOLOGY
0.3%
EMERGENCY MEDICINE
0.5%
BIOCHEMISTRY
0.2%
OTHER CLINICAL SCIENCES
0.2%
FAMILY PRACTICE
0.5%
MICROBIOLOGY
0.2%
PHYSICAL MEDICINE &
REHABILITATION
0.2%
ORTHOPEDIC SURGERY
0.4%
OTHER HEALTH PROFESSIONS
0.2%
OTHER HEALTH PROFESSIONS
0.2%
HOSPITALS LABS CLINICS
INSTITUTES
0.3%
ANATOMY
0.1%
EMERGENCY MEDICINE
< 0.1%
ADMINISTRATION
0.2%
ADMINISTRATION
0.1%
ADMINISTRATION
< 0.1%
EDUCATIONAL RESOURCES
0.1%
MISCELLANEOUS AREAS
0.1%
EDUCATIONAL RESOURCES
< 0.1%
OTHER HEALTH PROFESSIONS
0.1%
EDUCATIONAL RESOURCES
0.1%
VETERINARY SCIENCES
< 0.1%
VETERINARY SCIENCES
< 0.1%
HOSPITALS LABS CLINICS
INSTITUTES
< 0.1%
ENGINEERING
< 0.1%
ENGINEERING
< 0.1%
VETERINARY SCIENCES
< 0.1%
DENTISTRY
< 0.1%
DENTISTRY
< 0.1%
ENGINEERING
< 0.1%
MISCELLANEOUS AREAS
< 0.1%
MISCELLANEOUS AREAS
< 0.1%
DENTISTRY
< 0.1%

66
APPENDIX VII: Prior Support for K Applicants
Tables A.7.1 and A.7.2 provide the total number of applicants and awardees in each K activity that have prior NIH
support.
Table A.7.1 Prior NIH traineeship (T), fellowship (F), and loan repayment (L) support (Percent of cohort)
Activity
Prior T Support
Prior F Support
Prior T or F Support
Prior L Support
Applicants
Awardees
Applicant
s
Awardees
Applicants
Awardees
Applicant
s
Awardees
K01
547/1,150
(48%)
315/600
(53%)
251/1,150
(22%)
153/600
(26%)
658/1,150
(57%)
377/600
(63%)
27/1,150
(2%)
16/600
(3%)
K08
2,407/5,982
(40%)
1,622/3,745
(43%)
611/5,982
(10%)
425/3,745
(11%)
2,818/5,982
(47%)
1,898/3,745
(51%)
88/5,982
(1%)
43/3,745
(1%)
K23
916/2,271
(40%)
546/1,248
(44%)
134/2,271
(6%)
85/1,248
(7%)
979/2,271
(43%)
586/1,248
(47%)
140/2,271
(6%)
53/1,248
(4%)
Total
3,870/9,403
(41%)
2,483/5,593
(44%)
996/9,403
(11%)
663/5,593
(12%)
4,455/9,403
(47%)
2,861/5,593
(51%)
255/9,403
(3%)
112/5,593
(2%)
Note: Applicants who fit the criteria for more than one category are counted multiple times
Source: IMPAC II
Table A.7.2 All Prior NIH support (Percent of cohort)
Activity
Any
Prior Support
Prior Research (R)
Support
45
Prior Eligible
Research (R) or Program
Project (P) Support
Applicants
Awardees
Applicant
s
Awardees
Applicants
Awardees
K01
725/1,150
(63%)
418/600
(70%)
132/1,150
(11%)
78/600
(13%)
78/1,150
(7%)
44/600
(4%)
K08
2,939/5,982
(49%)
1,967/3,745
(53%)
259/5,982
(4%)
149/3,745
(4%)
86/5,982
(1%)
57/3,745
(1%)
K23
1,188/2,271
(52%)
688/1,248
(55%)
379/2,271
(17%)
191/1,248
(15%)
89/2,271
(4%)
44/1,248
(2%)
Total
4,852/9,403
(52%)
3,073/5,593
(55%)
770/9,403
(8%)
418/5,593
(7%)
253/9,403
(3%)
148/5,593
(2%)
Note: Applicants who fit the criteria for more than one category are counted multiple times
Source: IMPAC II
Figure A.7.1 illustrates that individuals with prior support were a greater percentage of awardees when compared
to applicants, suggesting that applicants with prior NIH support were more likely to receive K awards.
45
Prior Research Support specifically excludes grants of type T, F, K, A (traineeship activity used historically) and the following
activities: D15, D29.

67
Figure A.7.1. Prior NIH support for applicants and awardees, by activity
Source: IMPAC II
Applicants with prior
NIH support were more
likely to receive K
awards.
Applicants with prior
support were more
likely to receive K
awards.

68
APPENDIX VIII: Data Sources for Demographic Variables
Variable
Data Source(s), in order of Preference
Sex
IMPAC II
DRF
AAMC
Race/Ethnicity
IMPAC II
DRF
AAMC
Age
IMPAC II
DRF
AAMC
Degree(s)
IMPAC II
DRF
AAMC
Years Since Degree
IMPAC II
DRF
AAMC
Prior NIH Support
IMPAC II
Subsequent NIH Support
IMPAC II
Faculty Appointment
AAMC
Publications
Medline
Thomson Reuters Web of Science

69
APPENDIX IX: Subsequent Grant Outcomes for Full Population, by Sex
K01
Outcome Category
Funded
Female
(n=316)
Funded Male
(n=281)
Unfunded
Female
(n=260)
Unfunded
Male
(n=261)
Awarded Type R01
27%
40%
15%
18%
Awarded Type RPG (non-R01)
16%
15%
12%
13%
Awarded Type non-RPG
5%
6%
7%
9%
Applied but grant not awarded
35%
29%
34%
28%
Key Personnel
4%
3%
8%
8%
No subsequent NIH activity
13%
7%
24%
24%
K08
Outcome Category
Funded
Female
(n=1,122)
Funded
Male
(n=2,591)
Unfunded
Female
(n=637)
Unfunded
Male
(n=1420)
Awarded Type R01
35%
44%
13%
19%
Awarded Type RPG (non-R01)
11%
11%
7%
6%
Awarded Type non-RPG
8%
6%
11%
10%
Applied but grant not awarded
24%
23%
21%
21%
Key Personnel
2%
3%
5%
7%
No subsequent NIH activity
20%
13%
43%
37%
K23
Outcome Category
Funded
Female
(n=572)
Funded
Male
(n=656)
Unfunded
Female
(n=471)
Unfunded
Male
(n=493)
Awarded Type R01
28%
33%
7%
12%
Awarded Type RPG (non-R01)
14%
13%
9%
6%
Awarded Type non-RPG
21%
19%
18%
19%
Applied but grant not awarded
25%
23%
27%
24%
Key Personnel
3%
3%
8%
6%
No subsequent NIH activity
9%
9%
31%
33%

70
APPENDIX X: Subsequent Grant Outcomes for Full Population, by Degree
K01 (Funded)
Outcome Category
Funded
MD
(n=24)
Funded
PhD
(n=525)
Funded
MD/PhD
(n=44)
Funded
Dual
(n=7)
Awarded Type R01
8%
34%
45%
0%
Awarded Type RPG (non-R01)
8%
16%
7%
29%
Awarded Type non-RPG
21%
5%
2%
14%
Applied but grant not awarded
38%
31%
36%
43%
Key Personnel
8%
4%
2%
0%
No subsequent NIH activity
17%
10%
7%
14%
K01 (Unfunded)
Outcome Category
Unfunded
MD
(n=23)
Unfunded
PhD
(n=470)
Unfunded
MD/PhD
(n=45)
Unfunded
Dual
(n=7)
Awarded Type R01
17%
15%
20%
0%
Awarded Type RPG (non-R01)
17%
12%
7%
13%
Awarded Type non-RPG
4%
8%
4%
0%
Applied but grant not awarded
17%
30%
29%
63%
Key Personnel
9%
9%
7%
0%
No subsequent NIH activity
35%
25%
33%
25%
K08 (Funded)
Outcome Category
Funded
MD
(n=2,291)
Funded
PhD
(n=88)
Funded
MD/PhD
(n=1,162)
Funded
Dual
(n=77)
Awarded Type R01
40%
33%
47%
23%
Awarded Type RPG (non-R01)
11%
18%
10%
12%
Awarded Type non-RPG
7%
9%
7%
0%
Applied but grant not awarded
24%
24%
21%
32%
Key Personnel
3%
1%
2%
5%
No subsequent NIH activity
15%
15%
13%
27%

71
K08 (Unfunded)
Outcome Category
Unfunded
MD
(n=1,356)
Unfunded
PhD
(n=79)
Unfunded
MD/PhD
(n=523)
Unfunded
Dual
(n=67)
Awarded Type R01
16%
18%
21%
13%
Awarded Type RPG (non-R01)
6%
11%
6%
6%
Awarded Type non-RPG
10%
14%
8%
13%
Applied but grant not awarded
19%
16%
26%
22%
Key Personnel
6%
5%
8%
7%
No subsequent NIH activity
42%
34%
30%
37%
K23 (Funded)
Outcome Category
Funded
MD
(n=850)
Funded
PhD
(n=191)
Funded
MD/PhD
(n=152)
Funded
Dual
(n=31)
Awarded Type R01
29%
36%
34%
19%
Awarded Type RPG (non-R01)
13%
14%
11%
16%
Awarded Type non-RPG
23%
10%
20%
29%
Applied but grant not awarded
23%
27%
22%
13%
Key Personnel
2%
6%
3%
0%
No subsequent NIH activity
10%
8%
11%
23%
K23 (Unfunded)
Outcome Category
Unfunded
MD
(n=667)
Unfunded
PhD
(n=183)
Unfunded
MD/PhD
(n=118)
Unfunded
Dual
(n=21)
Awarded Type R01
8%
7%
19%
19%
Awarded Type RPG (non-R01)
6%
14%
3%
5%
Awarded Type non-RPG
21%
11%
15%
19%
Applied but grant not awarded
23%
28%
25%
33%
Key Personnel
7%
9%
8%
5%
No subsequent NIH activity
35%
31%
31%
19%

72
APPENDIX XI: Subsequent Grant Applications to Same IC as K Application
Table A.11 shows the percentage of subsequent grant applications that were submitted to the same IC as each
applicant’s K application.
46
The higher rates at which funded applicants applied for grants within the same IC were
not found to be significant. However, a small percentage of applicants in each cohort (approximately 10 percent)
had more than 10 subsequent grant applications. The percentage of applications to the same IC was lower for this
cohort than for the rest of the group. If applicants from this cohort (those with greater than 10 subsequent
applications) were excluded from the analysis (data not shown), statistically significant rates of application to the
same IC were evident in both the funded K01 and K23 cohorts. This finding suggests that mentored K participants
were more likely to stay within the same IC early in their research careers.
Table A.11. Percent of Subsequent Applications to the Same IC as K Application
Activity and
Award Status
Number of Applicants
(Percent with >10
applications)
Percent of
Applications to
Same IC
Average
Awards per
Person
(all ICs)
Percent of
Awards
from Same
IC
K01 Funded
(n=134)
103 (12%)
57%
1.27
18%
K01 Unfunded
(n=134)
86 (13%)
47%
1.31
18%
K08 Funded
(n=468)
334 (12%)
69%
1.59
25%
K08 Unfunded
(n=468)
182 (11%)
64%
1.44
23%
K23 Funded
(n=190)
128 (5%)
63%
1.20
19%
K23 Unfunded
(n=190)
84 (2%)
54%
1.24
14%
Note: No differences were seen to be significant.
Source: IMPAC II
46
Each applicant in this group has in-study K applications to exactly one IC and submitted at least one subsequent
grant application.
