
Health Safety & Work-Life Service Center
Safety and Environmental Health Division
Annual Safety Report
Fiscal Year 2015
This report describes the frequency and characteristics of mishaps associated with shore based units,
cutters, aviation/aviation support and boats. Off-duty mishaps, motor vehicle, and sports related injuries
are also summarized and described.

USCG HSWL Service Center Annual Safety Report FY15
Table of Contents Page 2 of 72
Table of Contents
Table of Contents ............................................................................................................................ 2
Introduction ..................................................................................................................................... 3
Overview and Mishap Summary .................................................................................................... 5
Cutter Operations .......................................................................................................................... 11
Boat Operations ............................................................................................................................ 19
Shore Operations ........................................................................................................................... 25
Deployable Special Forces (DSF) Operations .............................................................................. 30
Marine Environmental Response and Marine Inspection ............................................................. 32
Recreational and Off Duty Mishaps ............................................................................................. 33
Motor Vehicle Mishaps................................................................................................................. 35
Laser Illumination Mishaps .......................................................................................................... 36
Environmental & Occupational Illness Mishaps .......................................................................... 37
Safety and Environmental Health Resources ................................................................................ 40
Aviation Operations ...................................................................................................................... 42

USCG HSWL Service Center Annual Safety Report FY15
Introduction Page 3 of 72
Introduction
I am pleased to present the third USCG Annual Safety Report.
As you may notice, the title of this year’s report has changed to
reflect the purpose and intent of the report. My view is that this
report should not only report mishap information but it should
also be an avenue to promote the Coast Guard’s Safety
Management System (SMS) and to share important and relevant
safety information. Since the release of the FY14 HSWL Service
Center Annual Mishap Analysis Report, there have been two
changes to the Coast Guard’s Safety Management System (SMS)
that I would like to highlight. The development of Tactics,
Techniques, and Procedures (TTP) documents and establishment
of Safety and Risk Management (SARM) councils are among
the most significant and recent developments in the CG SMS.
HSWL SC Safety and Environmental Health (SEH)
professionals and subject matter experts from CG field units
currently collaborate to develop TTPs for specific topics
contained in the Safety & Environmental Health (SEH) Manual. FORCECOM publishes TTPs
and makes them available at the following link: HSWL SC (se) TTPs. To date, eight TTPs have
been completed, seven TTPs are in different stages of development in FY 16, and seven are
scheduled for completion in FY17.
The implementation of SARM councils has reached 54% completion in 2015. The intent of these
councils is to enhance AOR SEH programs by identifying, assessing, and addressing local
problem areas through recommendations of corrective measures and/or policy development. The
SARMs can be significant sources for sharing information and elevating innovative risk
management solutions to the Risk Management Steering Committee (RMSC) headed by CG-
113. The RMSC acts as a clearing house to address emerging cross-directorate SEH issues under
the SMS umbrella.
In addition to the recent developments in the CG SMS, we have learned many lessons through
the analysis of mishap information contained in our electronic mishap reporting systems (e-
MisReps and e-AVIATRs). Two salient findings are the failure to implement a unit specific
Mishap Response Plan (MRP) and establish a unit level Permanent Mishap Board (PMB) at
many units. Implementing and exercising MRPs, including the PMB, ensures coordinated efforts
after a mishap, secures evidence integrity and preservation of the mishap scene, and ultimately
assures the quality of data collection and of the final mishap analysis.
Another significant finding from our examination of enterprise safety practices reveals that,
despite a mandated annual requirement, usage of the Unit Safety Assessment Tool (USAT)
remains low. USAT is an online tool customizable to unit specific needs, allowing
documentation of self-inspections and the ability to track SEH deficiencies to completion.
Moreover, it is a basic and necessary resource for Commanders to promote a safety conscious
culture.

USCG HSWL Service Center Annual Safety Report FY15
Introduction Page 4 of 72
Lastly, the e-MisReps system is another element of the CG SMS that augments units’ ability to
maintain vigilance on their unit and/or community’s safety posture. Commanding Officers and
Officers-in-Charge can utilize the e-MisReps system to obtain current reports on mishap and
injury data. These reports raise awareness of safety concerns at their unit and of corrective
actions. In general, the e-MisReps system raises members’ awareness of conditions
compromising safety in CG work and living environments.
As you progress through this report, you’ll see that key takeaways are provided at the beginning
of each section. Communities should refer to their respective sections to review details and
analysis. I would like to offer these noteworthy cross-community observations from the 2015
Annual Safety Report:
Mishap analyses identified “judgment” as the most frequently cited contributing factor.
Our analysis revealed that CG members often use poor judgment when they feel
pressured to continue with a mission. The effect of using poor judgment has significant
consequences on the development of risk acceptance. In the operational environment,
members are exposed to risk on a regular basis. After the exposure, it is natural to
evaluate the experience and decide whether or not to take that risk again. If the exposure
did not result in any harm, eventually, the risk becomes “acceptable.”
While there were more on-duty mishaps, off-duty sports injuries accounted for the
majority of hospitalizations, lost work days, and days of restricted work. Unit leaders are
best positioned to reduce off-duty sports injuries by stressing the importance of
mitigating hazards even during off-duty hours, in recreational and sports activities.
Laceration and electric shock injuries were prevalent across several communities. In
these instances, analyses revealed frequent lack of job hazard analysis, incorrect
procedures, and using wrong tools for the job.
Lastly, slips, trips and falls were identified as the leading type of mishaps. Inadequate
lighting, wet and slippery surfaces, obstructed aisle and walkways, ladders, unguarded
openings, and elevated work surfaces were listed as contributing factors. In these cases,
daily unit self-inspections is one of the most effective ways to reduce this type of mishap.

USCG HSWL Service Center Annual Safety Report FY15
Overview and Mishap Summary Page 5 of 72
Overview and Mishap Summary
Key Takeaways
FY 15 total mishaps remained relatively the same when compared to the 10-year
average; cutter and boat units experienced a 15% and 21% decrease in the number of
mishaps respectively when compared to the 10-year average; however, Shore remained
relatively the same (within one standard deviation).
Cutter damage costs doubled from FY14 to FY15 ($2.0 to $4.1 million).
Injury rates increased across all categories from FY14 to FY15, with the largest
increase found on Cutters (1.94 to 2.59). Figure 1.3.
The number of reported mishaps may not reflect the actual number of mishaps
occurring in the field. Underreporting is recognized and we encourage commands to
accurately report mishaps.
This chapter provides an overall view of mishaps CG-wide and narrative summaries of all class
A and B mishaps. A more in-depth review of off-duty, recreational and motor vehicle mishaps
are covered separately in later chapters.
Graphic Representation of Annual Reported Mishaps:
Figure 1.1: Number of Mishaps Reported FY05-FY15: Total count of all mishaps by community
587
552
583
596
623
487
585
608
549
519
480
805
894
886
891
827
790
713
738
809
623
634
958
797
715
715
546
551
559
595
695
576
567
685
677
675
699
683
657
615
584
654
611
649
0
500
1000
1500
2000
2500
3000
3500
2005
2006
2007
2008
2009
2010
2011
2012
2013
2014
2015
Mishaps Reported
Cutters
Boat Units
AirSta / Aviation Support
Shore Units
USCG HSWL Service Center Annual Safety Report FY15
Overview and Mishap Summary Page 6 of 72
10 Year Average of Total
Mishaps
Standard Deviation
FY15 Mishaps
Shore Units
654
36
649
Air Stations & ALC
671
127
567
Boat Units
798
83
634
Cutters
569
40
480
Table 1.1: FY15 Mishaps compared to the 10 year mishap average (FY05 - FY14)
Figure 1.1 showed that total mishaps in FY15 remained stable when compared to the 10-year
average (2,330 in FY 15 vs. 2,630 as the 10-yr average). Cutter and Boat unit mishaps decreased
in FY15 (1.98 and 2.25 standard deviations from the 10-year average respectively). A review of
FY15 mishap data revealed a total of 16 Class A and Class B mishaps, (Aviation In-flight is
discussed in a later chapter) summarized below:
Class A - Operational:
Fatality – Civilian: The crew of a boat heard and felt the hull impact an object in the water. The
crew conducted a search of the area and found a small inflatable raft. There were no other objects
or persons located in the area. The crew finished the patrol and returned to base. The following
morning, local law enforcement recovered a deceased body in the vicinity of the impact. Three
days later, CGIS investigators working with local law enforcement determined that the victim
appeared to have been struck by a Coast Guard 33-foot SPC-LE.
Property Damage – Loss of Boat: A CGC was directed to rendezvous with a second cutter to
transfer 50 migrants. During the transfer, a large swell lifted the stern of the first cutter and water
came over the bow of the boat. The crew of the second cutter and the boat crew on the first cutter
started yelling “water over the bow”. The coxswain brought the jet drives bucket back slightly to
move the bow away from the cutter and then brought the bucket forward and increased throttle to
lift the bow through the wave. During this action water continued to come over the starboard
bow, causing the boat to roll to starboard and capsize. Total property damage amounted to
$390,466.12.
Class A - Non-Operational Vehicle/Vehicle Related:
Fatality – Active Duty: A group of Coast Guard members from a CGC departed a local
establishment. Upon leaving at approximately 0130, three members decided to cross a high-
density traffic highway on foot, the South Padre Island Drive. The visibility at that time was
reduced by low-lying fog. As the group proceeded across the highway, a van traveling
northbound at approximately 45 mph collided with the last member of the group.
Fatality – Active Duty: Boat Station. On the evening of 21 September 2015, three out of four
mishap members were at a fellow shipmates house socializing and drinking alcohol. The
designated driver reported arriving at the house at approximately 1900 and was asked to drive
the other three members to the store. The driver was handed keys to an F250 Ford truck
belonging to another mishap member.
On the return trip from the store, the vehicle came around sharp left-hand turn (posted at 30mph)
in the road. The vehicle encountered deer in the road. As the driver attempted to avoid the deer,
the PMVs right tires got off the paved surface onto loose gravel causing the PMV to “fishtail”.

USCG HSWL Service Center Annual Safety Report FY15
Overview and Mishap Summary Page 7 of 72
As the PMV came back onto the paved road surface, it regained full traction and hit an
embankment on the opposite side of the road, flipping onto the passenger side of the vehicle and
coming to rest in the oncoming lane. Three members reported hanging in the vehicle by their
seatbelts and were able to unclip and climb out of the driver’s side window. One member, who
had been seated in the front middle seat, reported difficulty unclipping seat buckle. Upon looking
down at the buckle, member noticed they had unclipped front passenger seat buckle and not their
own.
Upon exiting the vehicle, the same member reported noticing member from front passenger seat
(deceased) had suffered significant injuries, was partially ejected, draped over passenger side
door, and upper torso was lying underneath vehicle.
Fatality – Active Duty: A member assigned to a CGC was traveling home in a motor vehicle
when he lost control of his vehicle, which went off the road and struck a tree. Member died
instantly and the passenger (non-Coast Guard civilian) in the vehicle was MEDEVAC’d to the
hospital. She has since been discharged but confined to a wheel chair. The fatal mishap occurred
at 0100 hours on 31 August.
Class B - Operational:
Property Damage - Injury – Electrical Fire: CGC experienced an electrical fire in the #1
Switchboard. While cleaning in the auxiliary machinery space, a member heard three explosions
from the back of the #1 Switchboard. Upon investigation, fire and smoke was found coming
from the back of the switchboard. Nine personnel in the machinery space exited the space
without the use of EEBD’s and were seen by the onboard health service technician and TDY
physician assistant shortly thereafter for smoke inhalation. One member entered the space to
investigate and later donned an SCBA which ran low on air. Member was also seen for smoke
inhalation. All members were released without significant injury. Total cost of the switchboard
fire was reported as $629,178.
Injury – Active Duty: Member engaged in off-site Tactical Sustainment Training (TST),
member was acting as a role player during a use of force scenario. Member was in the prone
position and the Boarding Team Member (BTM) and Boarding Officer (BO) were attempting to
put the member in flex cuffs. The member went active and started to fight with the BTM. The
BO attempted to gain control of the member by delivering a knee strike to the side of the
member's right leg. As the BO's knee strike was about to make contact, the member switched to a
position on his side exposing his back. The knee strike landed in the middle of the member's
back, resulting in a possible lumbar fracture of his L1-L4 vertebrae.
Injury – Civilian: On 13 March 2015, at approximately 2330, a CG boat responded to a mayday
call from a 65-foot commercial fishing vessel reported aground north of the Port Everglades
inlet. Once on scene, the CG boat safely removed two people from the vessel. A third individual
attempted to jump to the boat and fell between the boats, resulting in initial reports of crush
injuries and lacerations to his leg and pelvis.
Property Damage – Grounding: On 20 February 2015, a CGC was underway, transiting from
Southwest Harbor, ME to Jonesport, ME. At approximately 1745, the cutter struck something
hard while passing through Petit Manna Bar.

USCG HSWL Service Center Annual Safety Report FY15
Overview and Mishap Summary Page 8 of 72
Property Damage – Grounding: After completing surf training off of Benson Beach, an MLB
was transiting inbound across Peacock Spit in 12-14 foot Surf, winds 25 - 30 knots out of the
SSW, visibility 04 nautical miles, when they struck a submerged object, 500 yards west of the tip
of north Jetty.
Injury – Active Duty: While attempting to moor a CGC to a mooring buoy, injured members
hand was impaled by the rope installer hook when the line paid out uncontrolled. The members
hand was drug into the cutters chock before the line to the installer could be cut to free the
injured member’s hand.
Class B - Non-Operational Vehicle/Vehicle Related:
Injury – Active Duty: Member was riding a motorcycle southbound on US Highway 17 in
Georgetown, SC on Sunday, 02 November 2014 at 1705 local time, when he lost control of his
motorcycle.
Injury – Active Duty: Member was riding Motocross on a track when he wrecked, sending him
over the handlebars. The force was enough to break both femurs. The momentum of the accident
also caused the member to continue over the handlebars, impacting the ground with enough force
to cause spinal injury. The extent of the spinal injury is unknown.
Injury – Active Duty: While on liberty, crewmember was involved in an auto accident in which
his front right tire blew out cause his 1998 Dodge Ram 2500 to lose control and slam into a
walnut orchard. Member was towing a personal camping trailer at the time. His wife and son
were killed and he sustained multiple fractures to the lower half of his body.
Injury - Active Duty: Member was on leave in Panama near Panama City. The member was on
a tour bus that had brake issues and went over a 20 meter drop.
Figure 1.2: FY05 – FY15 Mishap Related Property Damage (millions): Aviation total for FY10 of
$142.8 million removed to allow for visual representation of other years (see Table 1.2 below).
$0
$10
$20
$30
$40
$50
$60
2005
2006
2007
2008
2009
2010
2011
2012
2013
2014
2015
Property Damage Costs Iin Millions
Cutters
Shore Units
Boat Units
Aviation / AirSta

USCG HSWL Service Center Annual Safety Report FY15
Overview and Mishap Summary Page 9 of 72
Fiscal Year
Cutters
Shore Units
Boat Units
Aviation / AIRSTA
2005
$2.50
$0.34
$1.13
$23.43
2006
$4.93
$0.38
$1.75
$44.86
2007
$2.49
$0.58
$1.00
$10.22
2008
$2.94
$0.72
$1.10
$15.38
2009
$3.69
$0.75
$1.84
$9.33
2010
$2.65
$1.67
$1.46
$143.94
2011
$5.13
$0.64
$1.07
$4.66
2012
$4.23
$0.37
$0.91
$15.64
2013
$2.82
$1.39
$0.99
$7.90
2014
$2.00
$0.78
$1.12
$8.04
2015
$4.10
$0.48
$0.78
$5.23
Table 1.2: FY05 – FY15 Mishap Related Property Damage (millions)
Total reported mishaps remained almost the same in FY14 and FY15 (2,329 and 2,330
respectively) and property damage decreased slightly from $11.9 million to $10.6 million. Shore
units, boat units, and aviation/AIRSTA property damage decreased from FY14 to FY15;
however cutter damage doubled ($2.0 million in FY14 to $4.1 million in FY15). Additionally, a
134% decrease occurred in ground aviation and aviation support property damage while
reporting relatively the same number of mishaps (576 in FY14 vs. 567 in FY15).
Figure 1.3: On-Duty Coast Guard Injury Rates: (On-duty cutter rates include inport and underway
injuries).
As shown in Figure 1.3, cutters had the highest injury rate from FY05 to FY15 except for FY13.
Shore commands (minus boat units and AIRSTA/aviation support) had the lowest injury rates
from FY05 through FY15. Injury rates increased across all categories from FY14 to FY15, with
the largest increase found on cutters (1.94 to 2.59).
0.0
0.5
1.0
1.5
2.0
2.5
3.0
2005
2006
2007
2008
2009
2010
2011
2012
2013
2014
2015
Injuries per 100 Personnel
Cutters
Boat Units
AirSta / Aviation Support
Other Shore Commands
Total CG Rate

USCG HSWL Service Center Annual Safety Report FY15
Overview and Mishap Summary Page 10 of 72
Figure 1.4: Coast Guard Lost Time Case Rates.
FY05-FY14 Average of
Injuries
Standard Deviation
FY15 Injuries
Shore Units
111
18
108
Air Stations & ALC
58
13
58
Boat Units
169
15
158
Cutters
199
29
206
Table 1.3: FY15 Injuries Compared to the FY05-FY14 average
Although cutters had the largest increase in injury rates (1.94 to 2.59), figure 1.4 shows that Lost
Time Cases (LTC) decreased, suggesting the injuries experienced were minor (First Aid) and not
associated with Lost Work Days (LWD). For all other communities, LTC decreased as well,
except for boat units which showed an increase from 0.47 to 0.61.
0.00
0.20
0.40
0.60
0.80
1.00
1.20
1.40
1.60
2005
2006
2007
2008
2009
2010
2011
2012
2013
2014
2015
Lost Time Case Rate per 100 Personnel
Cutters
Boat Units
AirSta / Aviation Support
Other Shore Commands
Total CG Rate

USCG HSWL Service Center Annual Safety Report FY15
Cutter Operational Mishaps Page 11 of 72
Cutter Operations
Key Takeaways
Cutter injuris occur more often inport than underway.
In FY15, 42% of mishaps (47/113) were associated with Enforcement of Laws and
Treaties (ELT) operations; and resulted in 40 % of injuries (31/78).
Aids to Navigation (ATON) operations accounted for 23% of on-duty injuries (18/78)
in FY15.
In FY15, fires accounted for 17% of operational mishaps. Person in water, HP
petroleum leaks and slips, trips and falls accounted for 21% of cutter mishaps.
Underway Mishaps
Figure 2.1: Cutter Mishap Rate by Class for FY15 (Underway/Operational)
Figure 2.1 exhibits mishap rates for FY15 for all cutter classes. As a cautionary note, we would
like to emphasize that the many factors that contribute to mishap rates in any given year for a
specific cutter class are not necessarily the same for all cutter classes. Factors contributing to
mishap rates depend on operational complexities, crew dynamics, equipment maintenance status,
platform maintenance, and safety procedures relevant to each cutter class.
A review of number of mishaps reported in FY15 by cutter class identified an unusually high
mishap rate on the WAGB/WLBB class (158.2). Paradoxically, this class of cutter was
associated with extremely low usage of resource hours during FY15.

USCG HSWL Service Center Annual Safety Report FY15
Cutter Operational Mishaps Page 12 of 72
WMEC 270 (74.6), WLB (65.8), and WHEC (60.3) cutter classes exhibited the next highest
mishap rates. Usages of resource hours in these cases also suggest a possible relationship
between the low or moderately low usage of resource hours (approximately 50,000; 30,000; and
20,000, respectively) with a tendency for high mishap rates. However, we caution against
generalizing that low operational hours result in high mishap rates because data from many other
cutter classes do not support this association.
Examine figure 2.1, in particular rates and resource hours from WMSL (41.2), WMEC210
(47.5), WLR (41.3), WYTL (13.4), and WLIC (29.4), among others.
Figure 2.2: FY15 Cutter Mishaps by Mission (Underway/Operational)
Figure 2.2 shows the number of mishaps reported aboard all
cutter classes by mission types for FY15, revealing the majority
of underway cutter mishaps occurred during ELT and ATON
operations.
Forty-two percent of all mishaps reported (47 out of 113
mishaps) were associated with ELT, and 21% with ATON
missions (26 out of 113 reported mishaps). Fortunately, no
fatalities were reported in FY15. Note: these are frequency
counts of mishaps and do not account for operational hours.
Comparisons across missions are not valid because each
mission/platform is different and carries its own risks.
26
1
8
47
7
4
0
3
8
8
1
0
10
20
30
40
50
ATON
C&S
DO
ELT
IO
M+R
MER
OTHER
SAR
TRG
MI
Number of Mishaps
Mission
Description
ATON
Shore and Radio Navigation Aids
C&S
Command and/or Support
DO
Defense Operations
ELT
Enforcement of Laws and Treaties
OTHER
Other Not Listed
M+R
Maintenance and Repair
MER
Marine Environmental Response
MI
Marine Inspection
IO
Ice Operations
SAR
Search and Rescue
TRG
Training

USCG HSWL Service Center Annual Safety Report FY15
Cutter Operational Mishaps Page 13 of 72
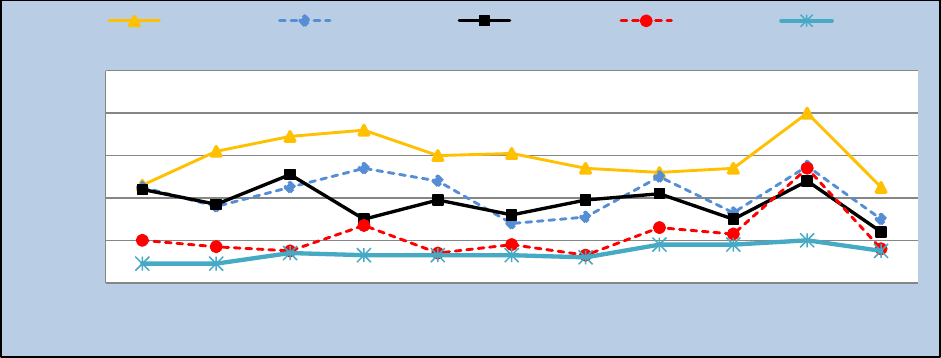
Figure 2.3: FY05 to FY15 Top Five Cutter Mishaps by Type (Underway/Operational)
The data reported in Figure 2.3 are frequency counts not rates, therefore limiting year to year comparisons
(i.e., operational hours were not used to normalize the data to a rate).
Figure 2.3 shows the FY15 top five most frequently reported operational mishaps. For the
purposes of contrast and comparison, data for the FY15 top five mishaps are also shown
retroactively from FY05 through FY14. Table 2.1 below, presents averages and standard
deviations calculated from FY05 through FY14 as well as total mishap reports for FY15.
Mishap reports for vessel collisions showed a decreasing trend from FY08 through FY13, a
temporary increase in FY14, and a return below the average in FY15. Person-In-Water (PIW),
High Pressure (HP), and Petroleum (Pet) leaks also exhibited sustained mishap frequencies near
their corresponding average frequencies throughout FY05-14. However, both mishap types
showed a noticeable decrease in FY15, falling below average values (eight FY15 total mishaps
reported in both cases). In contrast, the frequency of mishaps involving fires maintained a
sustained frequency near the 10-year average, including FY15.
To view a comprehensive report on fires aboard Coast Guard cutters, see Causative Factors of
Afloat Fires, on the Afloat Branch CG Portal page.
FY05-FY14 Average of
Type Mishaps
Standard Deviation
FY15 Types
Fire
19
8
19
Hp Pet Leaks
18
7
8
PIW
15
5
8
Slip Trip Fall
18
8
8
Collision Vessel
8
5
6
Table 2.1: Top Cutter Mishaps by Type, FY05 - FY14 (Underway/Operational)
15
12
13
9
1
5
1
2
4
15
6
18
15
26
13
7
12
11
18
26
33
8
16
19
11
24
17
12
10
11
7
20
8
9
25
13
29
18
14
21
27
10
14
8
10
20
17
32
22
7
26
29
16
15
19
0
20
40
60
80
100
120
2005
2006
2007
2008
2009
2010
2011
2012
2013
2014
2015
Number of Mishaps
Cutter Operational Mishaps by Type
Collision Vessel
Slip Trip Fall
PIW
Hp Pet Leaks
Fire

USCG HSWL Service Center Annual Safety Report FY15
Cutter Operational Mishaps Page 14 of 72
FY05-FY14 Average
Standard Deviation
FY15
UW Mishaps
126
16.0
113
UW Injuries
52
9.5
78
UW Lost Work Days
260
96.0
188
Cost (millions)
$3.34
$1.04
$4.10
Table 2.2: FY15 Cutter Crew Mishaps/injuries Compared to FY05 - FY14 (Underway/Operational)
Slips, trips and falls maintain yearly frequencies near the average value (Table 2.2 above),
mishap average of 18 from FY05-14, although in FY15 the trend was interrupted with a
noticeable decrease well below the average (eight total FY15 mishaps reported).
Figure 2.4: Cutter Injury Rates, FY05-FY15 (Underway/Operational)
Underway Injury rates increased in FY15 to 5.4 from 4.6 in FY14.
Analysis of Injuries
The injuries reported in this section are frequency counts and not rates. Information in this
section is from analysis of data from e-MisReps. The injuries discussed occurred while
underway.
Injuries by Mission: In FY15, there were 106 injuries inport (Table 2.3) and 78 underway
/operational (Table 2.2). Of the underway injuries, 17% (13/78) occurred during IO operations
on WAGB 399 class vessels, 15% (12/78) occurred during ELT
operations onboard WMEC 270 class vessels, and 15% (12/78)
occurred during DO operations aboard WPB 110 class vessels. Other
operations where injuries occurred were noted during ATON, C&S,
M+R, MI, SAR and training missions.
12.2
9.1
14.7
13.5
14.8
13.7
10.6
20.5
14.6
15.7
20.2
-
5.0
10.0
15.0
20.0
25.0
-
50,000
100,000
150,000
200,000
250,000
300,000
350,000
400,000
450,000
500,000
2005
2006
2007
2008
2009
2010
2011
2012
2013
2014
2015
Injuries per 100K Hours
Cutter Resource Hours
Cutter Resource Hours
Underway Injury Rate per 100K Op Hours
FY15 Cutter Underway Injuries
CUT/LACERATIONS
20
INHALATION
14
IRRITATION
12
BRUISE
9
SPRAIN
5
FRACTURE
5
OTHER
13
USCG HSWL Service Center Annual Safety Report FY15
Cutter Operational Mishaps Page 15 of 72
Cutter Injuries: Cuts / Lacerations were the highest reported injury accounting for 26% (20/78)
of the total cutter injuries, and of those, 40% (8) were caused while working on equipment
(includes pinching fingers and cuts while using small power tools, hand held tools, buoy deck
work, etc.). The common factor was performing maintenance on cutter equipment. Thirty-five
percent (7) of the cuts injuries were to the head or extremities from knife edges on hatches, water
tight doors or scuttles, and ladder wells. These occurred while members were transiting through
watertight doors/hatches or falling in ladder wells. Twenty-five percent (5) of cuts/lacerations
were caused by knives/box cutters. Opening packages and food preparation was the common
factor in knife-related mishaps.
Inhalation was responsible for 18% (14/78) of cutter injuries, and of those 71% (10) were due to
a single class Charlie fire. Four injuries were from smoke inhalation during an incinerator fire.
Irritations accounted for 15% (12/78) of injuries, and of those, 83% (10) were caused by crew
members’ eyes coming in contact with lasers from shore and other boats while conducting
operations underway.
Bruising accounted for 12% (9/78) of injuries from contact with doors, hatches, scuttles and
knife edges, during a vessel list, encountering high seas, unsecured equipment or members
attempting to transit ladders. Sprains were responsible for 6% (5/78) of injuries caused by
slips/trips/falls, and while transiting ladders.
Figure 2.5: Top Five Causal Factors: FY05-FY15 (Underway/Operational)
Numbers in brackets depict number of operational mishaps (per year). Each reported mishap can have
multiple causal factors.
In looking at the top underway causal factors (Figure 2.5), judgment was consistently cited as the
highest percentage each year and continued to be the leading causal factor reported in operational
cutter mishaps. Fatigue shows up as one of the top five causal factors for Underway/Operational
mishaps but it was not amongst the top five inport mishaps. Judgment, experience and planning
are personnel factors. Operational risk management can be applied to identify these latent unsafe
decisions before they manifest into mishaps.
0
20
40
60
80
100
2005
[107]
2006
[139]
2007
[142]
2008
[152]
2009
[128]
2010
[104]
2011
[131]
2012
[137]
2013
[106]
2014
[118]
2015
[113]
Number of Causal Factors
Judgment
Experience
Weather
Planning
Fatigue

USCG HSWL Service Center Annual Safety Report FY15
Cutter Operational Mishaps Page 16 of 72
Inport Mishaps
Figure 2.6: FY15 Type/Number of Cutter Injuries (Inport)
FY05-FY14 Average
Standard Deviation
FY15
Inport Mishaps
177
31.5
252
Inport Injuries
106
20.3
106
Inport Lost Work Days
451
152.4
347
Table 2.3: FY15 Cutter Crew Mishaps/Injuries Compared to FY05 - FY14 (Inport)
Analysis of Inport Injuries
Analysis of inport injuries revealed that most occurred during maintenance and repair activities.
In FY15, there were 106 injuries inport (figure 2.6), and cuts accounted for 23% (24/106). The
majorities of cuts were obtained while transiting ladders, catching body parts in QAWTD’s, and
the use of box cutters and knifes while opening packages/supplies. Bruises accounted for 16%
(16/106) of injuries and were due to slips trips and falls and while working on cutter equipment.
Fractures accounted for 11% (12/106) of injuries. Major causes of fractures were working on and
inspecting hatches and QAWTD’s slips, trips, and falls. Other notable injuries include irritation
of the eye caused by improper use of eye protection when performing the duties of fire watch,
working with small power tools, and handling chemicals.
3
1
16
3
6
24
7
12
2
7
2
11
10
2
0
5
10
15
20
25
30
Number of Injuries (Inport)

USCG HSWL Service Center Annual Safety Report FY15
Cutter Operational Mishaps Page 17 of 72
Figure 2.7: Top Five Causal Factors: FY05-FY15 (Inport)
Numbers in brackets depict number of mishaps (per year). Each reported mishap can have multiple causal
factors.
Similar to the Underway/Operational causal factors, judgment was consistently cited as the highest
percentage inport causal factor each year (figure 2.7) and continued to be the leading causal
factor reported. Judgment, experience, planning and management are personnel factors. Sports
causal factors are marked when a mishap occurs during command sponsored sporting events.
Although not shown, leading non-personal factors were engineering design and failure
(equipment/system) for both underway and inport.
0
20
40
60
80
100
120
140
2005
[205]
2006
[155]
2007
[129]
2008
[152]
2009
[187]
2010
[129]
2011
[192]
2012
[200]
2013
[218]
2014
[207]
2015
[252]
Number of Inport Causal Factors
Judgment
Experience
Sports
Planning
Management
USCG HSWL Service Center Annual Safety Report FY15
Cutter Operational Mishaps Page 18 of 72
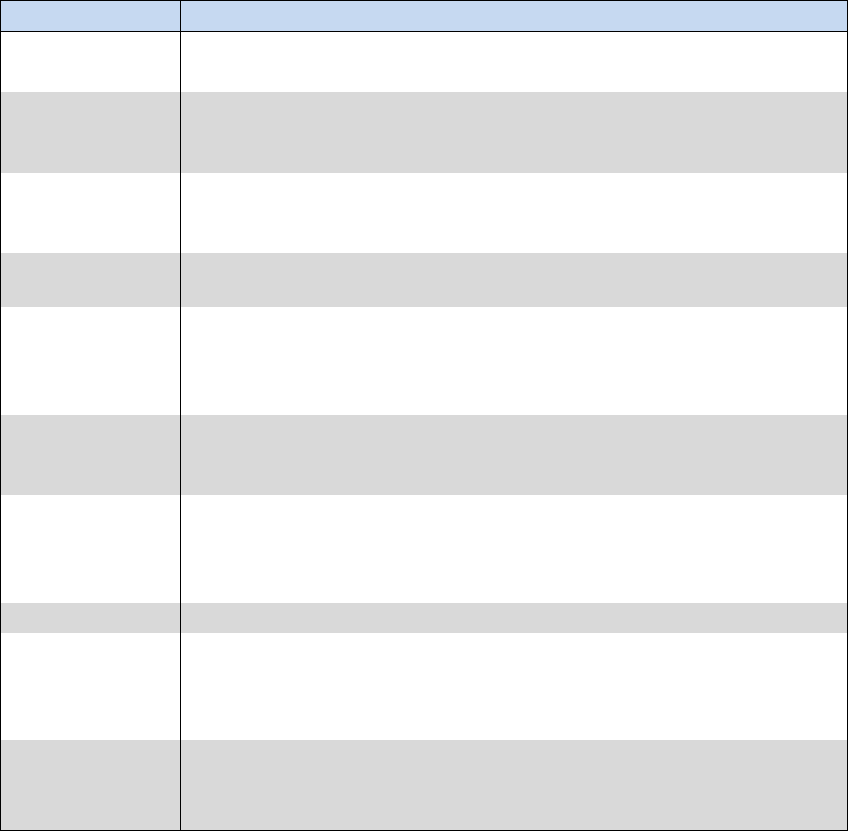
CG Cutter Top Ten Hazardous Conditions
Checklist Number
Checklist Item
ES-52
Electrical Safety; All electrical equipment shall be free from recognized
hazards that are likely to cause death or serious physical harm.
FS-54
Fire Safety; Flammable lockers are in good condition and doors are self-
closing and latch upon closure. A current inventory of the contents is
posted on the door of the cabinet.
ENG-05
Engineering; Guards are installed on all rotating machinery, including
couplings and exposed shafts, to prevent personnel from becoming
accidentally entangled or injured.
FS-55
Fire Safety; Compressed gas bottles are stored in an upright position
with individual steel collars.
ES-57
Electrical Safety; Transient voltage surge suppressors (computer power
strips) are to be mounted in a way that allows them to be removed
without the use of tools; cannot be series connected to one another
(daisy chained); and are not used in conjunction with extension cords.
ES-16
Electrical Safety; During normal operations, all fuse boxes, junction
boxes, switch boxes, electrical enclosures, and wiring accessories shall
be kept closed (with provided covers) and properly secured.
HC-11
Hazard Communication Program; Secondary containers for hazardous
materials are labeled, marked with name of materials as indicated on
the SDS, principal hazard, effects of overexposure, and name and
number of manufacturer or supplier.
HAB-02
Habitability; There are no food items in non-messing areas.
LLRD-06
Ladder Safety ; Three slip-resistant self-adhesive treads with no space
between them are installed at the head and foot of ladders, on each
side of doors used for continuous traffic, and at both sides of doors in
crews messing.
PPE-10
Personal Protective Equipment; Eyewash units are inspected and
maintained in accordance with manufacturer's instructions. Plumbed
equipment shall be activated weekly to verify proper operation.
Table 2.4: Cutter Safety Assessment Analysis - Top Ten Hazardous Conditions
Notifications (HCN’s) Recorded During FY15 Cutter Safety Assessments
Table 2.4 summarizes the top cutter SEH deficiencies, excluding administrative and training
items, identified during FY15 SMART visits and Ship Sanitation Certificate Program inspections
(formerly de-rats). Electrical discrepancies were the most cited discrepancies.

USCG HSWL Service Center Annual Safety Report FY15
Boat Operational Mishaps Page 19 of 72
Boat Operations
Key Takeaways
In FY15, most boat injuries occured at the pier; the most frequent injury was irritation
or a foreign object in CG member’s eyes.
Slips/trips and falls at the pier while transfering on and off the boat and between
platforms underway was the second largest cause on injury. This also attributed to the
increase to PIW’s (person-in-water).
Laser strikes to boat crew members doubled from the previous year.
There was a decrese in groundings, which predomintly occurred while at low speed
(clutch to around 3-5 knots).
Boat Unit Mishaps
Figure 3.1: FY15 Mishaps by Boat Type
1
11
5
42
22
63
67
2
1
20
9
16
6
0
10
20
30
40
50
60
70
80
Number of Mishaps

USCG HSWL Service Center Annual Safety Report FY15
Boat Operational Mishaps Page 20 of 72
Figure 3.2: FY15 Boat Mishaps by Mission Type.
Figure 3.1 and 3.2 show frequency counts of mishaps by boat type and mishaps by mission respectively
and does not account for operational hours (i.e., operational hours were not consistently available for
individual boat types or by missions in CGBI to normalize the
data to a rate). This limits comparisons across platforms and
missions.
As shown in Figure 3.1, the RB-M and RB-S II account for
49% of all boats mishaps reported in FY15. Analysis and
review of the reported mishaps across “Boat Types” and
“Mission Types” identified commonalities of mishap types
while in performance of CG missions. Figures 3.1 and 3.2
used the same mishap data set.
Mishap Summary
Analysis of boat unit mishaps revealed boat crews were exposed to “green” lasers while
patrolling and maintaining security zones during large public events. Several boat crew members
were injured (cuts, contusions, sprains, back pain) during aggressive maneuvering (hook-a-
chine), or coming off the back of a wave/swell. PIW’s (Person-In-Water) occurred: at the pier –
embarking, disembarking, mooring, and untying boats; during training missions - retrieving
OSCAR, or throwing the heaving line; hooking-a-chine; and law enforcement operations –
transferring between vessels.
23
3
3
32
14
1
1
23
14
43
108
0
20
40
60
80
100
120
ATON
C&S
DO
ELT
M+R
MER
MI
OTHER
PSS
SAR
TRG
Number of Mishaps
Mission
Description
ATON
Shore and Radio Navigation Aids
C&S
Command and/or Support
DO
Defense Operations
ELT
Enforcement of Laws and Treaties
OTHER
Other Not Listed
M+R
Maintenance and Repair
MER
Marine Environmental Response
MI
Marine Inspection
PSS
Port Safety and Security
SAR
Search and Rescue
TRG
Training
USCG HSWL Service Center Annual Safety Report FY15
Boat Operational Mishaps Page 21 of 72
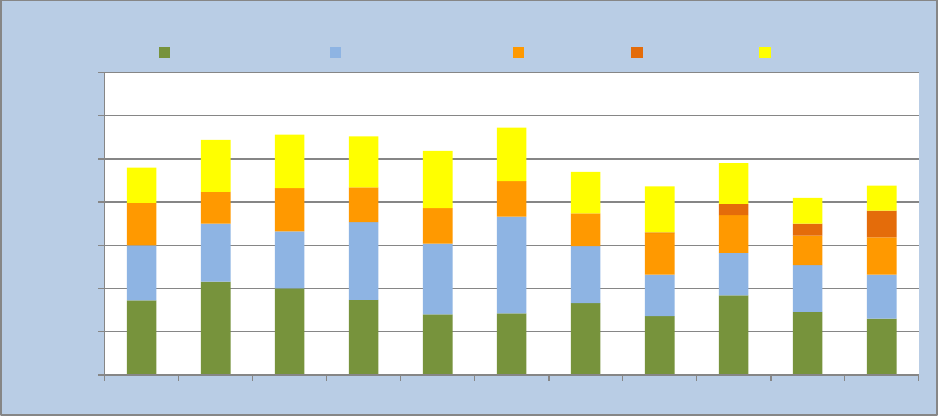
Figure 3.3: FY05 – FY15 Top Five Types of Boat Unit Mishaps.
Figure 3.3 shows the FY15 top five most frequently reported operational mishaps. For the
purpose of comparison, data for the FY15 top five mishaps are also shown retroactively from
FY05 through FY14. Table 3.1 below presents averages and standard deviations calculated from
FY05 through FY14 as well as total mishap reports for FY15.
The top five types of mishaps accounted for 35% (219/634) of the total. The number of
groundings showed a decreasing trend from FY13 through FY15. However, it was the most
frequently cited type of mishap in FY15 with a total damage cost of $75K (10% of total boat
unit’s damage costs). Groundings accounted for 30% (65/219) occurring while transiting shallow
water near channels and jetties, assisting vessels in distress, and while performing CG operations
such as ATON, ELT and SAR. Analysis of the groundings showed many occurred during
training of crew members while conducting area familiarization. The majority of groundings
occurred under “slow” speed (clutch ahead to 2-3 knots), where there was minimal to no damage
to the boat. Similarly, collisions between boat-to-boat, boat-to-pier, bridges, and locks occurred
at “slow” speed. Conversely, striking-a-submerged object occurred at “speed” and without
warning.
Laser mishap tracking began in FY13 and the numbers of reported laser mishaps were almost the
same in FY13 and FY14. However, there was a significant increase (121%) in FY15 compared
to FY14 (Figure 3.3).
Trailering mishaps, as shown in table 3.1, were reduced in FY15 significantly when compared to
the 10-year average (>2 standard deviations). Trailering persistently is the cause of mishaps with
the striking of overhead objects, garage doors, trees, low overhangs, and bridges while being
towed. In one mishap, the unit had spotters port and starboard, bow and stern – but nobody
looked UP! The boat was trailered and returning to the unit with the radar and antenna(s) in the
upright position.
86
108
100
87
70
71
83
68
92
73
65
64
67
66
90
82
112
66
48
49
54
51
49
37
50
40
41
41
38
48
44
34
43
0
0
0
0
0
0
0
1
13
14
31
41
60
62
59
66
62
48
53
47
30
29
0
50
100
150
200
250
300
350
2005
2006
2007
2008
2009
2010
2011
2012
2013
2014
2015
Number of Mishaps
Types of Mishaps - Top 5
Grounding
Slip Trip Fall
PIW
Laser
Trailering

USCG HSWL Service Center Annual Safety Report FY15
Boat Operational Mishaps Page 22 of 72
FY05-FY14 Average of Type
Mishaps
Standard Deviation
FY15 Types – Top 5
Grounding
84
13
65
Slip Trip Fall
70
19
51
PIW
42
5
43
Laser
3
5
31
Trailering
53
11
29
Table 3.1: Top Boat Mishaps Type FY15 compared to FY05-FY14 10-year average.
Note: Operational mishaps include underway mishaps only (steaming, anchoring, mooring, etc.).
Figure 3.4: Boat Underway Injury Rates, FY05-FY15
Underway Injury rates increased in FY15 to 5.1 from 4.4 in FY14. Table 3.2 shows in FY15 boat crew
members were injured more often inport (158) than underway (22). During our analysis of the
underway injuries, 41% (9/22) occurred during ELT operations on RB-S II and Defender Class
A&B boats, 23% (5/22) occurred during SAR operations onboard RB-S II, MLB-47 and SPC
(SW) boats, and 18% (4/22) occurred during waterway management operations aboard RB-S II
boats. Other operations where injuries occurred were noted during ATON and PSS.
10-Year Average of Total
Mishaps
Standard Deviation
FY15
Mishaps – Total
798
83
634
Injuries
169
15
158
Underway Injuries
35
13
22
Lost Time Cases
73
13
60
Lost Days
513
106
319
Property Costs (Millions)
$1.24
$0.31
$0.78
Table 3.2: Boat Unit Mishap Summary FY15 compared to FY05-FY14 10-year average
7.3
8.9
8.4
11.1
7.6
9.4
5.6
4.2
4.7
4.4
5.1
-
2
4
6
8
10
12
-
100,000
200,000
300,000
400,000
500,000
600,000
2005
2006
2007
2008
2009
2010
2011
2012
2013
2014
2015
Injuries Per 100K Resource Hours
Small Boat Op Hours
Boat OP Hours
Underway Injury Rate

USCG HSWL Service Center Annual Safety Report FY15
Boat Operational Mishaps Page 23 of 72
Analysis of Injuries
Small Boat Units (SBU’s) encompassing STAs, ANTs, MSSTs and
MSRTs reported a total of 158 injuries in FY15 (see table insert:
FY15 Boat Unit “Injury Type”). Slips/Trips/Falls were the most
frequent cause of injury, 30% (47/158). Irritation, foreign objects in
member’s eyes, (lasers, gasoline, and paint) accounted for 15%
(21/158) of the injuries.
Lacerations/Cuts - 15% (24/158) were inflicted by cutting
instruments (i.e. knives or razor blades); most commonly while
opening packages, cutting line, or preparing food. Lacerations /Cuts
also occur when member’s fall encountering heavy seas in boats,
cuts to the head or extremities from knife edges on hatches or doors.
These can be prevented by using snips or safety blades when
appropriate, and keeping a hand free when transiting through the
boat.
Recent changes to the Occupational Medical Surveillance and Evaluation Program (OMSEP)
requires personnel who are exposed to noise levels above the threshold limit value for a single
exposure vice a 30-day exposure are required to be enrolled in OMSEP. Coordinate enrollment
by contacting your local Safety and Environmental Health Officer (SEHO); for a listing, see
resources page located in the SEH Resources section.
Laser strikes, predominantly green lasers, striking boat crews from other small craft or from
shore accounted for 20% (31/158) of total mishaps. Out of the thirty-one mishaps, seven led to
eye irritation of boat crew.
Fractures accounted for 16% (25/158) of injuries. Six of the mishaps occurred while conducting
maintenance and repair; the remainder occurred during training, SAR, and ATON evolutions.
Of the injuries, sprains accounted for 13% (20/158) for boat units occurred underway and most
were from heavy seas, and members tripping, falling or stepping over equipment.
0
50
100
150
200
250
300
350
400
450
500
2005
[805]
2006
[894]
2007
[886]
2008
[891]
2009
[827]
2010
[790]
2011
[713]
2012
[738]
2013
[809]
2014
[623]
2015
[634]
Number of Causal Factors
Judgment
Experience
Planning
Weather
Communication
Y15 Boat Unit “ Injury Type”
FRACTURE
25
CUT
24
IRRITATION
21
SPRAIN
20
STRAIN
14
ABRASION
10
BRUISE
8
DISLOCATION
5
ELECTRICAL SHOCK
5
BURN
4
CONCUSSION
4
PUNCTURE
3
AMPUTATION
1
LOSS OF CONSCIOUSNESS
1
OTHER
13
Note: On Duty CG Only
Motor Vehicle Mishaps not Included.

USCG HSWL Service Center Annual Safety Report FY15
Boat Operational Mishaps Page 24 of 72
Figure 3.5: Top Five Causal Factors, FY05-FY15
Numbers in brackets depict the number of mishaps (per year). Multiple causal factors are routinely
identified by reporting units.
FY05-FY14 Average of Type
Mishaps
Standard Deviation
FY15 Types
Judgment
386
48
294
Experience
227
32
194
Planning
191
32
127
Weather
151
27
111
Communication
120
20
94
Table 3.3: FY15 Boat Operational Mishap Causal Factors
Four of the top five causal factors fall under the personal factors category shown in Table 3.3.
Similar to the operational cutter causal factors, judgment was consistently cited as the highest
percentage causal factor each year (figure 3.5) and continued to be the leading causal factor
reported. Judgment, experience, planning and communication are personnel factors. Although
not shown, leading non-personal factors were engineering design and failure
(equipment/system).
USCG HSWL Service Center Annual Safety Report FY15
Shore Mishaps Page 25 of 72
Shore Operations
Key Takeaways
Slips/Trips/Falls are consistently the leading type of mishap and accounted for over
60% of the FY05-FY15 period.
Cuts/Lacerations were the most commonly reported occupational injury; the most
frequent was from the use of knives.
The most often cited hazardous condition notifications are related to electrical system
conditions, egress & exiting procedures (EAP), and the lack of hearing conservation
training and documentation.
FY15 reported a total 649 mishap; of these, 144 were associated with injuries, and 92
resulted in property damage mishaps. The remaining 413 mishaps are associated with
HIPOs and mandatory reporting.
On and Off-Duty Mishaps (The mishaps in this chapter do not include Boat STAs. Shore
facilities include Bases, TRACENs, Boat Maintenance Facilities and Shops, Major Industrial
Units, Non–Industrial Units, and CG-occupied office spaces.)
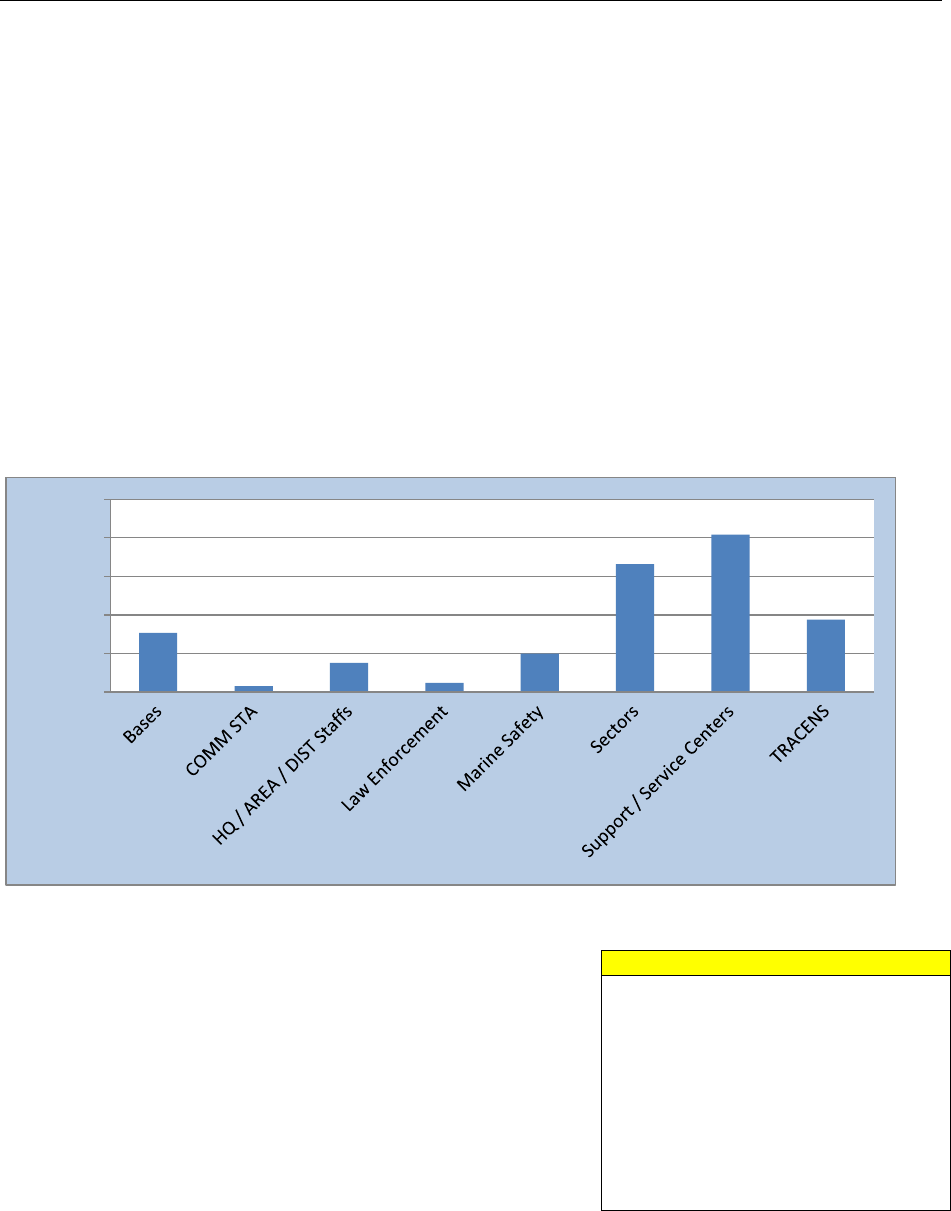
Figure 4.1: Mishaps by Major Shore Unit Types (On and Off Duty)
Off-duty mishaps are included in the figures above and
discussed in detail in a separate chapter. They are briefly
mentioned in this section to emphasize the impact they have
on operational missions. CG members’ individual
operational readiness is impacted when they experience an
off duty injuy resultining in hospitalized, lost, and restricted
work days. This has an overall effect on command
readiness and capabilities.
Motor vehicle, motorcycle, ATV, and off-road dirt bike
mishaps are also included in the above figures and further
analyzed in a later chaper.
77
8
38
12
50
166
204
94
0
50
100
150
200
250
Number of Mishaps
Mission
Description
ATON
Shore Navigation Aids
C&S
Command and/or Support
ELT
Enforcement of Laws and Treaties
OTHER
Other Not Listed
M+R
Maintenance and Repair
MER
Marine Environmental Response
MI
Marine Inspection
PERS
Off Duty/Off-The-Job
PSS
Port Safety and Security
TRG
Training

USCG HSWL Service Center Annual Safety Report FY15
Shore Mishaps Page 26 of 72
Figure 4.2: Shore Mishaps by Mission Type
Figure 4.3: Shore Personnel Injury and Lost Time Case Rates
FY05-FY14 Average
Standard Deviation
FY15
Total Mishaps
654
36
649
Injuries
142
16
144
Lost Time Cases
72
11
59
Lost Days
432
90
499
Property Cost
$0.76
$0.42
$0.48
Table 4.1: Shore Injuries, Mishaps, and Property Cost 10-Year Average vs. FY15
Yearly costs are not adjusted for inflation. This cost does not include property cost associated with Boat
Units (STAs, MSSTs, ANTs, and PSUs).
Over the past ten years, total shore mishaps averaged 654 mishaps per year with a standard
deviation of 36 mishaps. The number of shore reported mishaps remained consistent in FY15
when compared with the 10-year average. In the same period, mishap related property damage
decreased by $30,000 compared to the average.
4
93
3
157
6
18
17
260
2
89
0
50
100
150
200
250
300
ATON
C&S
ELT
M+R
MER
MI
OTHER
PERS
PSS
TRG
Number of Mishaps
0.00
0.10
0.20
0.30
0.40
0.50
0.60
0.70
2005
2006
2007
2008
2009
2010
2011
2012
2013
2014
2015
Injury and Lost Time Rate
per 100 people
Injury Incident Rate
Lost Time Case Rate

USCG HSWL Service Center Annual Safety Report FY15
Shore Mishaps Page 27 of 72
Analysis of FY15 Injuries
Cuts/Lacerations were the most commonly reported occupational injury, 24%
(27/144) occurring during normal working conditions as a result of a slip, trip
or fall, performing buoy maintenance, moving equipment utilizing a knife
while performing food preparation and the opening of boxes and packages.
Fractures were 12% (14/144) of shore facility injuries occurring during
sponsored training exercises (boarding member training, use-of-force
classes), slips, trips, and falls, the unintentional closing of doors and hatches,
and loading/unloading of material and equipment.
Inhalation precipitating an occupational or acute exposure occurred 10% (12/144) when
members inhaled ammonia vapors escaping from manifold valves while performing inspection,
contacting asbestos, and performing an oil facility safety examination and hydrogen sulfide was
detected by a member’s personally worn gas meter.
CG members received concussions during “Incentive Training” - passing out and striking their
head on the ground, during training (self defense, REDMAN) from blows to the head, and from
slips or falls on ice.
Figure 4.4: FY05 – FY15 Shore Mishaps by Type
97
118
109
131
129
148
95
79
90
109
91
37
42
36
35
33
29
23
17
25
21
23
12
7
9
8
17
15
6
9
17
7
10
13
8
6
7
2
10
9
11
6
7
8
10
10
7
8
9
8
8
8
7
4
8
0
50
100
150
200
250
2005
2006
2007
2008
2009
2010
2011
2012
2013
2014
2015
Number of Mishaps
Types of Shore Mishaps (10 years)
Slip Trip Fall
Lifting
Fire
PIW
Trailering
FY15 Shore Injuries
CUT
27
FRACTURE
14
INHALATION
12
STRAIN
8
BRUISE
7
CONCUSSION
7
SPRAIN
6
ABRASION
6
BURN
6
IRRITATION
4
OTHER
9

USCG HSWL Service Center Annual Safety Report FY15
Shore Mishaps Page 28 of 72
FY05-FY14 Average of Type
Mishaps
Standard Deviation
FY15 Types
Slip Trip Fall
111
20
91
Lifting
30
8
23
Fire
11
4
10
PIW
8
3
8
Trailering
8
2
8
Table 4.2: Top Shore Mishaps by Type, FY15 compared to FY05-FY14 10-year average
From FY05 to FY15, “slips, trips, and falls” is clearly identified as the leading mishap type.
Lighting, wet and slippery surfaces (walking and working surfaces), moving surfaces, blocked
and obstructed aisles and walkways, ladders, unguarded openings, and elevated work surfaces
are all contributing factors. Rushing, inattention, and distractions also contribute to falls.
Figure 4.5: Top Five Major Shore Causal Factors, FY05-FY15
FY05-FY14 Average of Type
Mishaps
Standard Deviation
FY15 Causal Factors
Judgment
283
31
243
Planning
119
16
130
Experience
96
17
90
Weather
48
10
54
Fatigue
36
5
53
Table 4.3: Top Five Major Causal Factors FY15 compared to FY05-FY14 10-year average
In looking at the top shore causal factors (Figure 4.5), judgment was consistently cited as the
highest percentage each year and continued to be the leading causal factor reported in shore
mishaps. Judgment, planning, and experience are personnel factors and Operational Risk
Management (ORM) can be applied to identify these latent unsafe decisions before they manifest
into mishaps.
0
50
100
150
200
250
300
350
2005
[685]
2006
[677]
2007
[675]
2008
[699]
2009
[683]
2010
[657]
2011
[615]
2012
[584]
2013
[654]
2014
[611]
2015
[649]
Number of Causal Factors
Judgment
Planning
Experience
Weather
Fatigue

USCG HSWL Service Center Annual Safety Report FY15
Shore Mishaps Page 29 of 72
Checklist Number
Checklist Item
EAP-08
The FEAP provides training so that personnel are familiar with the
provisions of the Facility's Emergency Action Plan.
EGR-07
All parts of the fire protection and life safety systems (e.g.,
automatic sprinklers, alarms, exit lighting, fire doors) are
maintained in proper operating condition.
EE-02
Circuit breakers in electrical distribution panels are labeled.
HCP-02
All personnel exposed to hazardous noise receive initial
(minimum of 1 hour) and appropriate annual refresher training in
hearing conservation practices. Training is documented in TMT.
EE-05
All outlet boxes, junction boxes, and fittings are provided with
covers.
EE-10
Flexible cords and cables are prohibited:
HABB-16
Reports of visible mold, biological growth, and moisture
intrusion/condensation indoors are promptly investigated,
sources of moisture are identified and eliminated, and all
affected building materials/contents are cleaned to mitigate and
prevent Indoor Air Quality problems.
EE-04
A 36-inch emergency access area is maintained in front of all
electrical distribution panels with voltages of 600 volts or less.
Note: This space may not be used for storage of any kind and
must remain open and clear at all times.
LOTO-10
The unit trains all personnel to ensure that the elements of the
Lockout Program are understood. Training is documented in
TMT.
FE-01
Fire extinguishers are present and visually inspected monthly.
Table 4.4: FY15 Shore, Safety Mobility, Assistance, Response and Training Visit
(SMART) - Top Ten Hazardous Conditions Notifications (HCN’s) identified during FY15 SMART
visits.
Electrical discrepancies are cited as the top material issues encompassing wiring, power strips,
extension cords, exposed electrical parts, missing GFCI’s, lack of panel clearance, and unlabeled
circuit breakers.
Fire and life safety issues included lack of emergency action plans, lack of general fire protection
system maintenance, and lack of exit signs.
Another common issue is the lack of hearing conservation training and documentation. Members
are encouraged to review COMDTINST M5100.47A, Chapter 10 B.3.f. OMSEP reports noise
(hearing) testing for individuals are currently at 48% in compliance Coast Guard-wide.

USCG HSWL Service Center Annual Safety Report FY15
Deployable Special Forces Page 30 of 72
Deployable Special Forces (DSF) Operations
Key Takeaways
In FY15 there were a total of 96 mishaps in the DSF community. Of the total mishaps,
38 (40%) occurred during training missions.
There was a total of 71 injuries during FY15. Forty-two injuries occurred while on
duty. Of the 42 on-duty injuries, 34 happened during training evolutions.
Due to the nature of the high risk evolutions performed in this community, continuous training
operations, and the physical demands placed on the operators, our mishap prevention efforts call
for nonstop emphasis both on- and off-duty.
Figure 5.1: FY15 DSF Mishaps by Mission.
As referenced in figure 5.1, there were a total of 96 mishaps in the DSF community in FY15. Of
the total mishaps, 40% (38/96) occurred during training missions; 31% (30/96) during off-duty,
and 11% (7/96) during C&S operations.
Figure 5.2: Top Five Types of DSF Mishaps, FY05-FY15
The top five mishaps types were identified in FY15 and these are compared to the same types of
mishaps from previous years (figure 5.2).

USCG HSWL Service Center Annual Safety Report FY15
Deployable Special Forces Page 31 of 72
The DSF community experienced a decrease in Trailering, PIWs and Unintentional Firearm
Discharge mishaps in FY15. Grounding and Allision was at the same level or had a slight
increase in the performance of boat operations.
FY05-FY14 Average of Type
Mishaps
Standard Deviation
FY15 Types
Grounding
6
4
6
Trailering
8
3
4
PIW
6
3
1
Allision
1
1
3
Firearm
3
2
2
Table 5.1: Top Five DSF Mishaps by Type , FY15 compared to FY05-FY14 10-year average
ON DUTY
OFF DUTY
Reported Injuries
42
28
Lost Work Days
62
304
Hospital days
2
14
Restricted Days
483
1214
Table 5.2: DSF FY15 Injuries with Lost Work
Analysis of Injuries
In FY15, there were a total of 70 injuries, 30 of which incurred lost work days. Fifty-nine percent
(42/70) of injuries occurred while members were in on-duty status and 40% (28/70) were off-
duty and off-the-job.
Of the on-duty injuries, 81% (34/70) took place during training evolutions; specific areas of
concern are: unit sponsored physical fitness, defense tactics (hand-to-hand), water survival
training, hook and climb, fast rope, and obstacle courses.
The DSF community experienced one class B mishap with “partial disability,” resulting in a
fractured back while role playing during Tactical Sustainment Training (TST) in a use-of-force
scenario.
Each mishap impacted our ability to some degree to support specialized mission capabilities and
deployment readiness. There were 30 lost work cases reported. Off-duty mishaps were
accountable for 83% (304/366) lost work days, 88% (14/16) hospital days, and 72% (1214/1697)
restricted days. Property damage mishaps resulted in $171K in repairs or replacement.
For more information on DSF specific mishaps, contact HSWL SC (se) at (757) 628-4392.

USCG HSWL Service Center Annual Safety Report FY15
Marine Environmental Response and Marine Inspection Page 32 of 72
Marine Environmental Response and Marine Inspection
In FY15, there were a total of 28 mishaps of which 25 mishaps involved injuries related to
Marine Inspections and Marine Environmental Response efforts accounting for 29 lost work
days, 3 hospital days, and 108 restricted days.
Ten of the injuries involved inhalation, and four involved cuts/lacerations by CG inspectors. In
the most severe cases of exposure, four inspectors entered unknowingly into a facility that was
contaminated with asbestos while investigating the source of oil discharging into the water.
Members were exposed for approximately 20 minutes and disturbed little if none of the asbestos.
In another incident, three inspectors noticed their gas meter had registered exposure to hydrogen
sulfide while conducting a security exam of a bulk oil facility. Minor dizziness was noted and
subsided after members left the site.
In one incident, while the member was conducting an inspection of a small passenger vessel, the
member injured their back when the member fell into an open hatch. The member was
hospitalized for two days. Another member was hospitalized for one day while conducting an
internal structural examination of a freight barge, due to the difficult design of the vessel’s
internal structures.
Vessel examinations during construction or extensive alterations, particularly those by marine
inspectors on barges are inherently dangerous. The need for the inspector to climb to inspect
areas that are not accessible increases the hazard of the job. Units should review local policies
and procedures to ensure proper safeguards are present during marine inspection activities of this
nature.
USCG HSWL Service Center Annual Safety Report FY15
Off-Duty and Recreational Mishaps Page 33 of 72
Recreational and Off Duty Mishaps
Key Takeaways
Sports are the highest contributors to off-duty mishaps.
Off-duty sports/fitness activities accounted for 360 injuries in FY15, while 72 sports
injuries were on-duty (command fitness activity).
Basketball injuries accounted for 279 lost work days and 1,962 restricted days.
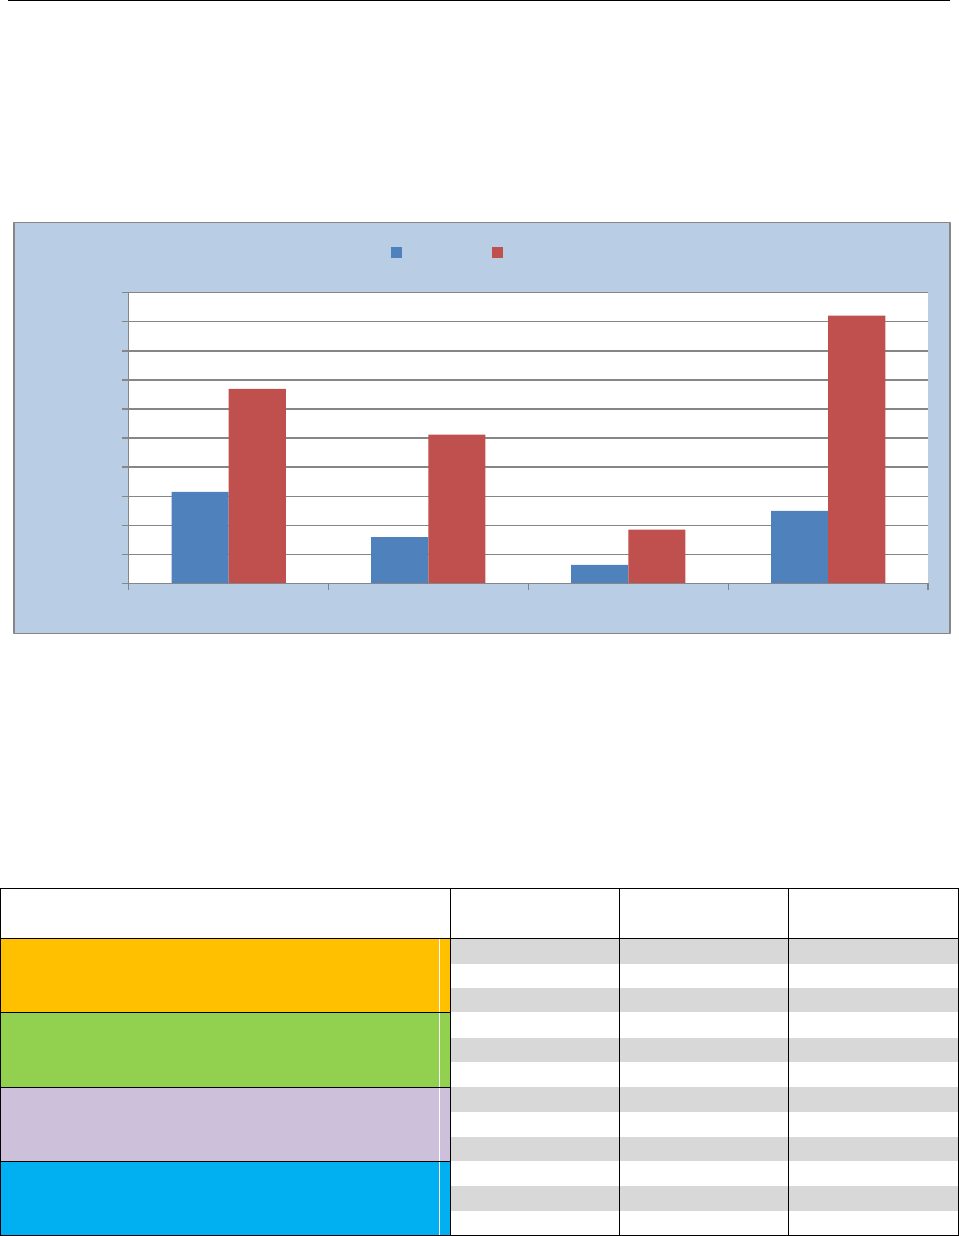
Figure 6.1: FY15 Days Lost Due to Injury (hospitalized and restricted)
There were more off-duty mishaps as a whole and accounted for the majority of the injuries,
hospitalizations, lost workdays, and days restricted. Our goal is to eliminate unsafe acts, reduce
mishaps, and eliminate risky behavior—anything less is unacceptable.
In December 2014 (FY15 Q1), a group of members were crossing a highway in the early
morning hours during a time of low-lying fog. The last member to cross was struck by a van and
later died of the injuries incurred.
Off-Duty
FY05- FY14
Average
Standard
Deviation
FY15
Cutter Injuries
167
14
119
Cutter Lost Time Cases
124
14
83
Cutter Lost Days
1780
395
1338
SBU Injuries
178
20
162
SBU Off-Duty Lost Time Cases
116
12
93
SBU Lost Days
1301
212
1021
Aviation/Av Support Injuries
71
12
66
Aviation/Av Support Lost Time Cases
50
11
34
Aviation/Av Support Lost Time Cases
534
230
370
Shore Injuries
224
21
260
Shore Lost Time Cases
170
18
187
Shore Lost Days
1580
271
1847
Table 6.1: Summary of Off-Duty Injuries, Lost Time Cases, and Lost Days
Note: off-duty only accounts for military personnel.
629
319
126
499
1338
1024
370
1844
0
200
400
600
800
1000
1200
1400
1600
1800
2000
Cutter Crews
Small Boat Units
Aviation Support
Shore
Days Lost
On Duty
Off Duty

USCG HSWL Service Center Annual Safety Report FY15
Off-Duty and Recreational Mishaps Page 34 of 72
Sports are the highest contributors to off-duty mishaps. Many injuries are severe, with significant
lost work days which ultimately impact the readiness of the unit. For instance, basketball
accounted for 279 lost work days and 1,962 restricted days. Football was responsible for 317 lost
work days and 1025 restricted days. Over the past 10 years, injuries attributed to on-duty sports
activities averaged 65 injuries per year, while off-duty sports related injuries averaged 262 per
year. In FY15, there were 72 on-duty sports injuries and 276 off-duty sports injuries.
Figure 6.2: Top Twelve Sports or Fitness Activities Implicated in FY15 Injury Mishaps
Analysis of the basketball mishaps indicated that ankle injuries are the leading type with the
highest incidents occurring during the winter months.
Snowboarding continues to be the leading cause of snow sports mishaps, accounting for 18 out
of 21 injuries. Mishap reports indicated helmets were worn in most instances and these injuries
were mainly wrist and shoulder related. Off-highway vehicle (dirt bikes and ATVs) mishaps
declined significantly again this fiscal year. Over the 10 year period, off-highway related injuries
averaged 34 events per year, with only 12 being reported during FY15.
As with afloat and shore on-duty mishaps, personal factors are the leading causal classification
for off-duty injuries. This emphasizes the importance of the human element in risk mitigation
and hazard avoidance.

USCG HSWL Service Center Annual Safety Report FY15
Off-Duty and Recreational Mishaps Page 35 of 72
Motor Vehicle Mishaps
Key Takeaways
About 50% of motor vehicle mishaps over the last 10 years involved motorcycles.
In FY15, no motorcycle mishaps resulted in fatalities. Most members involved in
motorcycle accidents had received at least the minimum motorcycle training required.
Figure 7.1: Class A Fatal Motor Vehicle Mishaps Passenger Vehicles and Motorcycles
Off-duty motor vehicle mishaps typically lead the list of causes for CG fatalities each year.
During FY15, two members were lost in fatal vehicular crashes. For the first time in over 10
years, there were no fatalities caused while riding motorcycles. However, there were 52
mishaps involving motorcycles, mopeds and ATVs during FY15 which resulted in 855 lost work
days, 157 hospital days, and 1123 restricted days. These numbers are significant in that, on
average, each mishap resulted in approximately 11 lost work days.
Most motorcyclists had received at least the minimum required motorcycle safety training. The
Coast Guard provides support in obtaining either local Coast Guard or DOD training or
reimburses the member for commercial training.
The latest National Highway Traffic Safety Administration (NHTSA) published data found that,
“per mile traveled, motorcyclists were more than 26 times more likely than passenger car
occupants to die in a traffic crash.” The most straightforward risk management strategy to
significantly increase the chances of surviving a motor vehicle crash is to drive a modern car or
truck, wear seatbelts all the time, and drive responsibly.

USCG HSWL Service Center Annual Safety Report FY15
Laser Illumination Mishaps Page 36 of 72
Laser Illumination Mishaps
Key Takeaways
The number of laser illumination incidents continues to rise. One possible solution -
coordinate with local municipalties and authorities to discourage the sale of handheld
lasers in high tourism areas.
Eye irritation (flash blinding) is the most prevalent injury when a laser illumination
occurs.
Figure 8.1: FY05 – FY15 Laser Illuminations (Non-Aviation)
The number of laser devices is proliferating and can pose a threat to the eye, both temporarily
and permanently. The frequency of laser exposures is likely to continue rising as evidenced over
the past few years. A sharp increase in the number of laser exposure events is reflected in Figure
8.1, indicating a significant increase in vessels and boats. Laser events for non-aviation units
have only been tracked in the mishap database starting FY13.
As laser strikes initiated from shore and other small craft continues to rise, it causes concern for
members. Laser exposures can have a wide range of effects including flash blindness, dazzle,
dark spots, hazy vision, floaters, burns, retinal bleeding, etc. Of special interest are the hazards
posed by visible lasers from glare and flash blindness.
All personnel who report being lased must seek medical evaluation. If an optometrist or
ophthalmologist confirms an acute laser overexposure incident, report the laser incident to the
immediate operational chain of command and the Tri-Service LASER Injury Hotline at 800-473-
3549.
Additional laser policy, guidance and reporting procedures are provided in the following
references:
Safety and Environmental Health Manual, COMDTINST M5100.47 (series), Chapter 3
Mishap Response; Chapter 23 Non-Ionizing Radiation Program.
ALCOAST 251/13: ASSET SPECIFIC LASER INCIDENT GUIDANCE
0
0
0
0
0
0
0
0
0
0
7
0
0
0
0
0
0
0
1
13
14
31
0
0
0
0
0
0
0
0
0
0
0
0
5
10
15
20
25
30
35
2005
2006
2007
2008
2009
2010
2011
2012
2013
2014
2015
Number of Laser Incidents
Cutter Laser Incidents
Shore Laser Incidents
Small Boat Incidents

USCG HSWL Service Center Annual Safety Report FY15
Environmental & Occupational Illness Mishaps Page 37 of 72
Environmental & Occupational Illness Mishaps
BACKGROUND:
Historically, the number of mishap reports submitted each year due to occupational illnesses has
been very low. This might be interpreted as an indication of exceptionally safe workplaces and
operations in the Coast Guard or merely a deficiency in reporting. As discussed below, based on
our recent health risk assessment findings, the latter explanation appears to be the most likely.
However, the actual explanation for the low annual occupational illness incidence reported by
the mishap system is more complex.
REPORTING REQUIREMENTS:
According to CG instructions, in addition to physical work-related injuries, occupational
illnesses that result in any of the following: death, days away from work, restricted duty, transfer
to another job, medical treatment beyond first aid, or loss of consciousness are also reportable
mishaps. Occupational illnesses include acute (short-term exposure) and chronic (long-term
exposure) illnesses such as, but not limited to, skin diseases (i.e. contact dermatitis), respiratory
disorders (i.e. occupational asthma), poisoning (i.e. lead), hearing loss (i.e. standard threshold
shift), work-related Musculoskeletal Disorders (MSD), occupational exposures to active
tuberculosis resulting in subsequent infection, and work-related needle stick injuries and cuts
from sharp objects contaminated with potentially infectious material.
Accordingly, a mishap report shall be initiated upon first diagnosis for illnesses linked to chronic
exposures. Therefore, Coast Guard units are required to submit a mishap report when military or
civilian personnel develop exposure-related illnesses as determined by a health care provider and
when attributed to chemical, physical, or biological agent exposures in the workplace or during a
hazardous materials response.
In addition, it is recommended that units submit Class D mishap reports for events with high
potential for loss (HIPO) and Coast Guard-wide implications, which can be used as indicators of
trends and can teach valuable lessons. Near mishaps are reportable even though they may result
in minimal or no damage, may not have resulted in personnel injury, or may not otherwise be
reportable in the mishap reporting system. Any near misses that may identify possible
deficiencies in current operational policy or procedures, allowances, outfits or personal
protective equipment (PPE), platform configuration, or performance regardless of whether
injury, illness, or damage results must be reported.
HEALTH RISK ASSESSMENT:
Over the last two years HSWL SC (se) has conducted more than 250 health risks assessments
(HRA) at shore facilities and on cutters to evaluate worker exposures to asbestos, lead,
chromium, beryllium, mercury, isocyanates, volatile organic chemicals, mold, noise, heat stress
and many other occupational stressors. In addition, our teams have visited hundreds of units to
evaluate operations and assist commands in identify hazardous conditions. During these visits,
our teams have routinely observed hazardous conditions with high potential for worker
exposures and have also identified exposures that exceeded contaminant occupational action
USCG HSWL Service Center Annual Safety Report FY15
Environmental & Occupational Illness Mishaps Page 38 of 72
levels and/or exposure limits. For example, exposure risks for asbestos and/or lead dust were
identified onboard more than 50 Cutters, lead dust exposure risks were identified at several small
arms firing ranges and armories, and hexavalent chromium and/or isocyanate exposures and
exposure risks were identified at 23 air stations during coating removal and application
operations. These examples only represent a small sample of the findings from our assessments.
As previously mentioned, hazardous conditions with high potential for worker exposures have
often been observed. For example, observing damaged friable asbestos-containing materials in
an occupied space, crews scraping lead-containing paint, and welding stainless steel without
proper engineering controls and personal protective equipment. In many cases, our teams witness
these processes and operations while in progress and were not able to collect personal air
samples to determine if exposures exceeded the applicable exposure limits. Instead, the SEH
member would make a professional judgment regarding the exposure, prescribe safe work
practices and personal protective equipment necessary to mitigate the exposure risks, provide
hazard awareness training to personnel, and then arrange to conduct a health risk assessment
including collecting personal air samples to evaluate the actual exposure risks. In addition, the
SEH staff often hears stories from unit personnel regarding potentially hazardous exposures and
near miss events that occurred during operations and missions. Most of these exchanges occur
during training sessions, where an increase in hazard awareness often triggers retrospective
evaluation of the member’s previous experiences. However, the majority of these personnel
indicate that these events were not reported to their command or through the mishap reporting
system. In addition, many personnel report that they did not seek medical attention or consult
with a medical provider after experiencing symptoms following a potential exposure event.
Therefore, these events are not captured, flagged for risk assessments, shared with other units
that may encounter similar conditions, or used to reduce risks and improve safety and health in
the Coast Guard. In addition, it is worth noting that risk assessment and sampling data gaps also
exist in other higher risk missions and operations. This is especially true for the marine safety
and security communities whose workplace consists of waterfront facilities, vessels, and
shipyards, where personnel encounter diverse and constantly changing exposure risks.
DISCUSSION:
Given the fiscal climate and resource limitations, it is not possible for the SEH community to
evaluate all Coast Guard exposure risks. Therefore, we adopted an alternate and multi-faceted
strategy to identify and prioritize exposure risks by leveraging the resources and funding
available.
In 2011, all Coast Guard units were directed to perform annual unit safety assessments using the
Unit Safety Assessment Tool. The goals of this initiative were to encourage more participation
and ownership in the safety and health program at the unit level and to allow our SMART Teams
to shift some of their focus from identifying facility-related deficiencies (fire and life safety) to
recognition, evaluation, and control of exposures and hazards associated with higher risk
missions, operations, and activities. In addition, this process would allow us to review and trend
unit-identified hazardous conditions across the Coast Guard, which would assist the SEH
community in prioritizing and focusing available resources on the highest risk missions,
operations, and activities.
Concurrently, we began to perform gap analyses studies by examining historical health risk
assessment reports, exposure data, mishap statistics, and new/changing occupational safety and
USCG HSWL Service Center Annual Safety Report FY15
Environmental & Occupational Illness Mishaps Page 39 of 72
health regulations. The primary objectives were to identify Coast Guard operations/activities
with high exposure risks where health risk assessment information and exposure data were either
insufficient or non-existent. In addition, we developed standardized assessment protocols,
coordinated enterprise-wide health risk assessments for the priority high risk operations,
developed hazard-specific safe work practices and unit-level hazard awareness training modules
to mitigate the hazards and enhance unit awareness, and recommended additional engineering
controls as needed to further reduce exposure risks.

Safety and Environmental Health Resources Page 40 of 72
Safety and Environmental Health Resources
CG Portal Resources
The HSWL SC Safety and Environmental Health Division portal page contains all current
information, safety alerts, safety newsletters, training resources, safety checklists for afloat and
shore units, as well as links to other agencies. The portal page offers centralized access to all our
safety applications: Mishap Reporting System (e-MisReps), Hazardous Condition Management
System (HCMS), Occupational Medical Surveillance and Evaluation Program (OMSEP), Unit
Safety Assessment Tool (USAT), the Video Lending Library, and the quarterly newsletter, The
Signal. Health, Safety and Work-Life Service Center Safety and Environmental Health Division
Portal Site
Mishap Response Plan (MRP) Resources
Roles and responsibilities for pre-mishap planning and mishap response are found in the Safety
and Environmental Health Manual, COMDTINST M5100.47A, Chap 3. USCG units need
actionable procedures to initiate an effective mishap response and allow further analysis and
evidence collection. A unit Mishap Response Plan (MRP) provides the unit a checklist to guide
them through the mishap response and reporting procedure. The Mishap Response and Reporting
TTP, CGTTP 1-03.2, provides steps for the Commanding Officer/Officer-in-Charge (CO/OIC)
to develop, implement, exercise, and maintain a unit mishap response plan. This TTP applies to
afloat, ashore, and ground mishaps. Mishap Response and Reporting TTP
CG Aviation Safety Portal Resources
Additional aviation safety information is available for review on the Flight Safety Officer (FSO)
portal site. There are several links to resources commonly used by CG FSOs. Some examples
include: Aviation Incident Reporting and Accident System (e-AVIATRS) user guide and
appendices, unit best practices, FSO Standardization Course content, FSO contact map, flight
data animations, sanitized mishap files, safety survey results, etc. FSOs can access the site by
typing the keywords “Flight Safety” in any portal search field or by clicking on this link: Flight
Safety Officer Portal Site.
CG Public Internet Safety Resources
Occasionally, safety information must be accessed from outside the CG Portal firewall. To
support open access requirements, selected safety resources are available to the public or
detached duty CG personnel that cannot connect to the CG Portal. Quick access to publicly
accessible safety resources is available at this link: CG-113 Portal Site.
When CG Portal access is not available, mishap response personnel can access key mishap
reporting and analysis guidance at this link: Mishap Reporting and Analysis Guidance.
Tactics, Techniques and Procedures (TTP)
The HSWL SC Safety and Environmental Health Division TTP portal page contains all the
current guidance on Safety and Environmental Health Programs: HSWL SC SEH TTPs.

Safety and Environmental Health Resources Page 41 of 72
Safety and Environmental Health Points of Contact
USCG Health, Safety and Work-Life Service Center (HSWL SC)
Safety and Environmental Health Division (se)
300 E. Main Street, Suite 1000
Norfolk, VA 23510-9109
Safety Environment Health Division Staff
Main Number (757) 628-4392
Division Chief: VACANT (757) 628-4392
Division Deputy: CAPT Harry Rhambarose (757) 628-4426 / (757) 647-1007 Cell
Safety & Occupational Health Assistant: Ms. Mary Ferguson (757) 628-4392
Afloat Support Branch Chief: CWO4 Matthew Bordeaux (757) 628-4413
Environmental Health Branch Chief: CDR Harold Hurst (757) 628-4403 / (757) 615-2132 Cell
Information Management Branch Chief: Ms. Teresa Lane (757) 628-4422
Shore Safety Branch Chief: Mr. John Kummers, CSP (757) 628-4423 / (757) 646-4055 Cell
Field Operations Branch Chief: CDR Michael Boley (757) 628-4409 / (757) 544-6176 Cell
Field Ops Branch Deputy: LCDR (SEL) Joe Johnson (757) 628-4410 / (757) 615-2133 Cell
Aviation Safety (CG-1131): CDR Frank Flood (202) 475-5147
DSF Safety Specialist: VACANT (757) 628-4392 (main desk)
Detached Offices
D1 Boston LCDR Meredith Gillman (617) 223-3202 / (757) 641-2097 Cell
D5 Portsmouth LCDR Patrick Wallace (757) 483-8496 / (757) 647-6426 Cell
D7 Miami LT Ben Tuxhorn (305) 953-2370 / (757) 647-6399 Cell
D8 New Orleans LT Douglas Fallon (504) 253-4731 / (757) 615-2139 Cell
D8WR St. Louis LCDR Bonnie Shaner (314) 269-2467 / (757) 635-7052 Cell
D9 Cleveland LCDR Don Hoeschele (216) 902-6395 / (757) 650-2172 Cell
D11 North (Alameda) LCDR Thida Buttke (510) 437-3672 / (510) 290-5472 Cell
D11 South (San Pedro) LT Chrisy Walsh (310) 521-6021 / (424) 225-0690 Cell
D13 Seattle LT Aaron Riutta (206) 217-6341 / (206) 310-0093 Cell
D14 Honolulu LT Melvin Torres (808) 842-2996 / (808) 366-4280 Cell
D17 Kodiak CAPT Melburn Dayton (907) 487-5757 Ext. 6830 / (907) 654-4091 Cell
D17 Ketchikan LT Ray Carter (907) 228-0317 / (907) 617-0442 Cell
Headquarters, Office of Safety and Environmental Health, Commandant (CG-113)
A roster of CG-113 personnel is available at http://www.uscg.mil/hq/cg1/cg11/contact.asp.

Safety Annual Report
U.S. Coast Guard
Aviation Safety
Annual Report
FY2015
Fiscal Year 2014
Office of Safety and Environmental Health (CG-113)

Annual Safety Report – Aviation Supplement FY 2015
CG-1131 Aviation Safety Program Page 43of 72
Message from the Safety Program Management Division Chief
This report represents a core component of the Coast Guard’s Safety Management System
(SMS). It has been designed to present mishap statistics from FY2015 along with some historical
data for comparative purposes. It also spotlights mishaps from each airframe community. The
headquarters safety team hopes that it will provide you with sufficient information with which
you can build strategies designed to mitigate areas of vulnerability. We also hope that you will
incorporate it into your unit safety stand downs to illustrate to your pilots and aircrew that, while
aviation safety cultures are improving, there is much progress to be made.
As you review the report you will notice that in FY2015 there was a noticeable increase in the
amount of mishaps that occurred compared to FY2014. While this increase demands thorough
analysis to identify concerning trends, I want to encourage you to also see this increase as an
indicator as to how our safety culture is improving. Specifically, I feel this increase is indicative
of a climate where pilots and aircrew feel secure in the knowledge that they can report a mishap
without having to be concerned that it will reflect poorly on themselves or their shipmates. This
feeling of assurance is a direct product of a safety culture which encourages reporting so that we
as an aviation corps can learn from our mishaps; be informed as to their causes and the corrective
actions that are taken to prevent them in the future; be flexible enough to make changes which
are necessary; and, most importantly, respond to mishaps in a fashion which is just. Were our
safety culture not in good health, I believe that we would have seen a decrease in mishap events
in FY2015 rather than in increase; not because mishaps were occurring less frequently, but
because they were not being reported.
In closing, please know that the CG-1131 team stands ready to assist you and your units with all
facets of your unit SMS.
Good luck and FLY SAFE!
Commander Frank L. Flood

HSWL SC Mishap Report FY15 Safety and Environmental Health Resources
CG-1131 Aviation Safety Program Page 44of 72
Overall Performance Review Abbreviations
The following abbreviations apply to the safety information in this report.
FM: Flight Mishap, as defined as “mishaps involving Coast Guard aircraft damage/loss with or
without other property damage, personnel injury/death, or occupational illness, where intent for
flight existed at the time of the mishap.”
FRM: Flight-Related Mishap, as defined as “mishaps where there is no Coast Guard aircraft
damage. Intent for flight must have existed at the time of the mishap, and other property damage,
death, injury or occupational illness may have occurred. This includes near midair collisions,
non-aircraft damage or injuries caused by rotor wash, and other reportable events with NO
reportable Coast Guard aircraft damage.”
AGM: Aviation Ground Mishap, as defined as “mishaps involving damage to Coast Guard
aircraft or aviation equipment, or where death, injury, or occupational illness occurred and no
intent for flight existed (e.g., towing, maintenance, run-ups, servicing, etc.).”
NMAC: Near Midair Collision
PF: Pilot Flying. Formerly termed “pilot-at-controls.”
PM: Pilot Monitoring. Formerly termed “pilot-not-at-controls” or “safety pilot”
HF: Human Factor. For this report, HF implies a mishap in which a crewmember’s action,
inaction, or decision was primary contributor or causal to the mishap event
FDM: Final Decision (Safety) Message, i.e., VCG’s final mishap report from major (Class A and
B) mishaps
DA: Directed Action from VCG-released FDM
RA: Recommended Action from unit mishap report (Class C, D, or E; released via Admin OIX)

HSWL SC Mishap Report FY15 Safety and Environmental Health Resources
CG-1131 Aviation Safety Program Page 45of 72
Mishap Class Severity Thresholds
Class
Personnel
Assets
A
Fatality; permanent total disability; missing
or missing in action
Reportable property damage ≥ $2M
Acft missing, abandoned
Midair collision
B
Permanent partial disability; 3+ personnel
inpatient hospitalized
$500,000 ≤ reportable property damage < $2M
C
Lost work time beyond event day or shift;
placement on limited duty or restricted duty
status; removal fm flight status; or, transfer
of individual to different job
$50,000 ≤ reportable property damage < $499,999
D
Require more than simple first aid but not
Class C criteria
$0 ≤ reportable property damage < $49,999
High Potential for Loss (HIPO) mishaps IAW
COMDTINST M5100.47 Section 3.E.1.f
Near midair collisions
Other flight-related mishaps IAW M5100.47A
E
Not applicable
Engine damage only regardless of cost
Table 1.1: Severity thresholds expressed in terms of personnel and asset loss shown by mishap
class used to determine mishap reporting requirements.
Overall Aviation Mishap Totals
During Fiscal Year 2015, the Coast Guard (CG) aviation fleet logged 111,993.3 flight hours.
The Coast Guard operational fleet experienced one Class A Mishap, one Class B mishap, 33
Class C mishaps, 463 Class D mishaps, and 32 Class E mishaps. Our Coast Guard Air Auxiliary
fleet experienced zero Class A mishaps, one Class B mishap, one Class C mishap, five Class D
mishaps, and zero Class E mishaps. This annual report incorporates ALCOAST 162/15 revised
mishap damage reporting thresholds which eliminated ‘Beyond Economical Repair’ events as
the sole criteria for aircraft Class A mishap determinations. Enclosed in this report is a summary
of operational aviation mishaps by number and rate, differentiated by class, operational mode
and airframe. Our operational fleet reported 79 more mishaps than Fiscal Year 2014, which is a
17% increase.

HSWL SC Mishap Report FY15 Safety and Environmental Health Resources
CG-1131 Aviation Safety Program Page 46of 72
FY 2015 Mishap Count by Class
Class
A
Class
B
Class
C
Class D
Class E
Trend
since
prev FY
%
change
fm FY14
Flt hr
delta
since
FY14
Rotary-wing
1* (0)
0 (0)
22 (14)
375 (303)
19 (25)
+75
+22%
-1%
Fixed-wing
0 (0)
1* (0)
7 (10)
84 (68)
13 (26)
+1
+1%
+3%
Auxiliary
0 (0)
1 (0)
1 (0)
5 (7)
0 (0)
0
0%
+2%
Non Asset-
Specific
0 (0)
0 (0)
4 (0)
4 (5)
0 (0)
+3
+60%
N/a
Total
1 (0)
2 (0)
34 (24)
468 (383)
32 (51)
+79
+17%
N/a
*CG6515 and CG1712 FDM in final stages of review.
Table 1.2: FY15 Mishap total shown by class and asset type. FY14 mishap totals are shown in
parenthesis.
Mishap Costs by OPMODE (FY 2015)
Class A
Class B
Class C
Class D
Class E
Total
Flight Mishaps
$2,003,917*
$650,340*
$1,779,611
$1,425,840
$1,665,598
$5,453,569
Flt-Rel Mishaps
-
-
-
$45,392
$598
$45,990
Ground Mishaps
-
-
$974,435
$190,942
$90,561
$,255,938
All
$2,003,917
$650,340
$2,754,046
$1,662,174
$1,756,757
$6,755,497
Table 1.3: Mishap Costs by OPMODE.
*Includes preliminary damage costs from CG6515 and CG1712 mishaps.

HSWL SC Mishap Report FY15 Safety and Environmental Health Resources
CG-1131 Aviation Safety Program Page 47of 72
MH-60 Performance Review
MH-60 Mishaps by OPMODE (FY 2011-2015)
Figure 2.1: Total number of mishaps shown by fiscal year and OPMODE. Total flight hours presented in
trendline.
MH-60 Mishaps by Class
Class A
Class B
Class C
Class D
Class E
Total
FY15
0
0
9
83
5
97
3-yr avg
0
0
7.3
52.0
6.0
65.3
5-yr avg
0
0
5.6
46.0
6.0
57.6
Table 2.1: MH-60 mishaps by class compared to three (FY12-14) and five (FY10-14) year averages.
MH-60 Mishaps by Causal Factor (FY 2015)
Materiel
Physical Environment
All HF
HF - Aircrew
HF -
Maintenance
Total
FM
36
3
11
9
2
50
%
72%
6%
22%
18%
4%
FRM
7
10
20
19
1
37
%
19%
27%
54%
51%
3%
AGM
4
0
6
3
3
10
%
40%
0%
60%
30%
30%
All H-
60
47
13
37
31
6
97
%
48%
13%
38%
32%
6%
Table 2.2: Total causal factor numbers are comprised of materiel, physical environment, and all HF data.
All HF numbers are comprised of HF-Aircrew and HF- Maintenance data.
12
16
40
30
50
8
17
20
20
37
11
12
17
13
10
0
5000
10000
15000
20000
25000
30000
0
20
40
60
80
100
120
FY11
FY12
FY13
FY14
FY15
Flight Hours
Number of Mishaps
Ground
Flt-Rel
Flight
Flt Hours

HSWL SC Mishap Report FY15 Safety and Environmental Health Resources
CG-1131 Aviation Safety Program Page 48of 72
MH-60 Mishap Factors
Materiel Factor Mishaps
Non-Materiel Mishaps
Breakdown by affected /
malfunctioning system
Breakdown by category
Engine
10
Hoist Ops
11
Electrical
6
Laser Exposure
7
Fuel
6
Maintenance Error
7
Main Gear Box
6
Birdstrike
3
Airframe
5
Near Midair
3
AFCS
3
Fueling / Defueling Ops
2
Hydraulics
3
External Load Ops
2
APU
2
Rotorwash
2
Tail Rotor
2
Things Falling Off Aircraft
2
ECU
1
Inadvertent IMC
2
Hoist
1
Preflight
1
Main Rotor
1
Overtorque
1
Other
1
Gunners Belt Usage
1
Total
47
Engine Starting Ops
1
Hangar Ops
1
Confined Area Ops
1
Minimum Equipment List
1
Stabilator
1
Landing Ops
1
Total
50
Table 2.3: MH-60 mishap factors frequency counts shown by affected/malfunctioning system and
category.
MH-60 Mishap Briefs (non-privileged)
ECU Compressor – Class C: While flying level at 1200’ over open ocean, pilot and crew noticed a
burning smell and immediately turned to RTB. In-flight troubleshooting revealed no popped circuit
breakers, smoke, or source of smell. All engine, system, and equipment indications were normal. Pilot
secured the ECS IAW Smoke and Fume Elimination procedure and burning smell disappeared. MH-60T
crew landed with no further indications. While on deck, pilot turned ECS back on and the smell
immediately reappeared.
Fuel System / Eye Injury – Class C: After an evening trainer, MH-60T was pressure refueled with the
power on IAW the MH-60T Maintenance Manual (CGTO 1H-60T-2-V1). Minutes after refueling, a
maintenance technician noticed that the right inboard gravity refuel cap was misaligned (arrow was not
pointing forward). The maintainer removed the cap to correct the discrepancy and was subsequently
sprayed in the face and upper torso with fuel.
Tail Rotor Blade Delamination – Class C: MH60T, Tail Rotor Blade delamination found on post flight.
During post flight inspection, the blue/black TRB assembly failed blade deflection test. Upon further
inspection, maintenance found outboard retention blade nylon shim deformed, damage to the blue/black
blade nylon wrap, and delamination of the spar.

HSWL SC Mishap Report FY15 Safety and Environmental Health Resources
CG-1131 Aviation Safety Program Page 49of 72
Head Injury – Class C: Member had just completed inspecting the ejectors atop a MH-60T. While
departing the aircraft, the member ducked to pass under the main rotor blade. The member did not duck
low enough and cut their scalp on a cotter pin where the main rotor blade connects to the rotor head. The
member finished departing the aircraft and was referred to medical.
Electrical Shock Injury – Class C: MH-60T mechanic working on electrical system received a shock;
experienced discomfort in arm and hand; transported to hospital for treatment and released same day.
While trouble shooting wire repairs inside the center overhead console of the MH-60T, the service
member (SM) was instructed to check for voltage on three unlabeled and uncapped wires terminating in
the overhead console. With the power off, the SM set up for the test using alligator clips and a multi-
meter. The SM then energized various switches on the open center overhead console to see if any applied
AC or DC power to the wires in question. While shifting the test leads from one wire to the other the back
of the SM's right hand made contact with an exposed switch. This caused the SM's arm to immediately
tense up and jerk away from the console. Approximately two hours later the SM was still experiencing
pain and was referred to the ER for a check. The SM was released later that night after being cleared and
given a list of symptoms to monitor.
Fuel Tank Jettison – Class C: Upon initial take-off from a hover at max gross weight, an MH-60T
experienced an uncommanded jettison of both left external tanks after the Weight-On-Wheels (WOW)
switch was disengaged. The crew conducted an uneventful land back on the taxi way and aborted the
flight.
Inadvertent IMC– Class D: MH-60T crew encountered IIMC during climbout after ASM boat
operations. The crew was conducting night-time fast rope training with a contract vessel. Upon
completion of the evolution, the crew began a routine climb up to 500' AWL for the return flight to stage
field where new ropers would be picked up. While passing 350' during the climb, the aircraft went IIMC.
Both pilots transferred to an instrument scan and the pilot flying leveled the aircraft at 450'. Based on
radar data and the fact that they were still over water, the crew elected to conduct a slow (200 ft/min)
descent back to known VMC. They regained VMC at 350' and proceeded to the stage field. The crew
terminated training and returned to base on an IFR flight plan.
Inadvertent Activation of Cargo Hook Squib – Class D: While performing the Prestart Checklist prior
to conducting a recurrent training flight for confined/rough area landings and external load operations, an
inadvertent firing of the cargo hook pyrotechnic squib occurred on a MH-60T during the Emergency
Release Test portion of the Cargo Hook Operational Check.
Rotorwash – Class D: A functional test flight (FCF) was conducted in a MH60T which included AFCS
and controllability checks in a hover. While conducting the hover check portions of the test flight, the
rotor wash, aided by the prevailing winds, affected the horizontal stabilizer of a CG HC-130H parked on
the aircraft ramp nearby. The elevator of the HC-130H was aggressively shifted from the full down
position to the full up position, damaging the elevator control system of the aircraft.
Engine Oil System – Class E: MH60T experienced increasing number 1 engine oil temperature and
decreasing pressure during pattern training flight. While at approximately 800 feet MSL on the upwind
leg of a traffic pattern, the Co-Pilot (CP) verbalized that the number 1 engine oil temperature was in the
precautionary range reading 135 degrees Celsius and the oil pressure was indicating 46 psi. As a
comparison, the number 2 engine indicated an oil temperature of 92 degrees Celsius and an oil pressure of
65 psi. The aircrew obtained an immediate landing clearance and conducted a running landing at 70kts.
The aircraft was taxied to parking and a normal shutdown was completed without further incident.
Engine Flameout – Class E: The mishap aircraft experienced a number two engine flameout as it
touched down during a routine Day Land trainer. During the third circuit in the traffic pattern at home
field, the IP in the left seat retarded the number two PCL just forward of the IDLE detent to simulate a
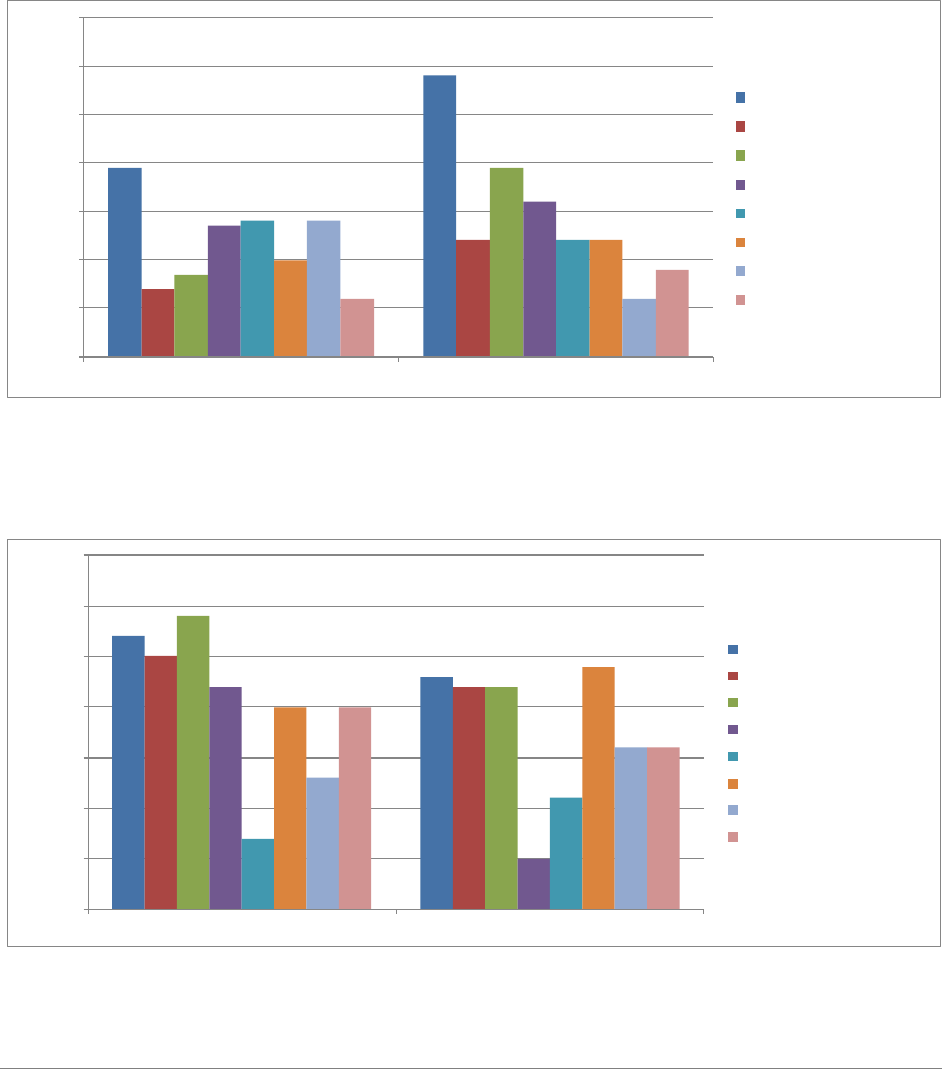
HSWL SC Mishap Report FY15 Safety and Environmental Health Resources
CG-1131 Aviation Safety Program Page 50of 72
single engine condition and called for a minimum speed landing. On short final at approximately 15 feet
AGL, the rotor speed drooped to 97 percent. The IP called CONTINUE, DON'T LAND and advanced
the number two PCL forward enough to regain 100 percent rotor speed. At this time the number two PCL
was at approximately the 4 o'clock position, or 1/3 of the way between the IDLE and FLY detents. Once
100 percent rotor speed was gained, the IP called for a landing and the flying pilot conducted a no-hover
landing. As the aircraft touched down and the collective was fully lowered, all crewmembers heard an
engine roll back. The IP in the left seat concurrently noticed a red "X" over the number two engine
instrumentation, indicating a flameout.
MH-60 Top Safety Concerns
*Only highest-scoring responses shown; lower-scoring responses were removed but are available on the FSO Portal
Figure 2.2: Percentage of total MH-60 pilot and aircrew respondents that selected specific safety concern
from fiscal year 2015 operational safety survey.
MH-60 Top Mishap-Producing Conditions
*Only highest-scoring responses shown; lower-scoring responses were removed but are available on the FSO Portal.
Figure 2.3: Percentage of total MH-60 pilot and aircrew respondents that selected specific
mishap producing condition from fiscal year 2015 operational safety survey.
39%
58%
14%
24%
17%
39%
27%
32%
28%
24%
20%
24%
28%
12%
12%
18%
0%
10%
20%
30%
40%
50%
60%
70%
H-60 Pilot
H-60 Aircrew
Percentage of Total Respondents*
Personnel Shortage
Crew Training
Maintenance Tempo
Ops Tempo
Crew Fatigue
Caring for Crews
Non-Punitive Reporting Culture
Crew Experience Level
27%
23%
25%
22%
29%
22%
22%
5%
7%
11%
20%
24%
13%
16%
20%
16%
0%
5%
10%
15%
20%
25%
30%
35%
H-60 Pilot
H-60 Aircrew
Percentage of Total Respondents*
Complacency/Inattention
Poor Weather
Fatigue
Congested Operating Area
Maintenance Error
Rushing
Unknown/Unidentified Hazard
Inexperience

HSWL SC Mishap Report FY15 Safety and Environmental Health Resources
CG-1131 Aviation Safety Program Page 51of 72
MH-65 Performance Review
MH-65 Mishaps by OPMODE (FY 2011-2015)
Figure 3.1: Total number of mishaps shown by fiscal year and OPMODE. Total flight hours presented in
trendline.
MH-65 Mishaps by Class
Class A
Class B
Class C
Class D
Class E
Total
FY15
1
0
13
292
14
320
3-yr avg
0.7
0.3
14.7
253.3
25.0
294.0
5-yr avg
0.8
0.6
15.8
234.0
25.4
276.6
Table 3.1: MH-65 mishaps by class compared to three (FY12-14) and five (FY10-14) year averages.
MH-65 Mishaps by Causal Factor (FY 2015)
Materiel
Physical
Environment
All HF
HF -
Aircrew
HF -
Maintenance
Total
FM
95
6
41
39
2
142
%
67%
4%
29%
27%
1%
FRM
31
50
64
49
15
145
%
21%
34%
44%
34%
10%
AGM
8
0
25
9
16
33
%
24%
0%
76%
27%
48%
All H-65
134
56
130
97
33
320
%
42%
18%
41%
30%
10%
Table 3.2: Total causal factor numbers are comprised of materiel, physical environment, and all HF data.
All HF numbers are comprised of HF-Aircrew and HF- Maintenance data.

HSWL SC Mishap Report FY15 Safety and Environmental Health Resources
CG-1131 Aviation Safety Program Page 52of 72
MH-65 Mishap Factors
Materiel Factor Mishaps
Non-Materiel Mishaps
Breakdown by affected /
malfunctioning system
Breakdown by category
Engine
21
Laser Exposure
37
Main Gear Box
17
Maintenance Error
36
Electrical
16
Main Gearbox Overtorque
28
AFCS Flt Controls
15
Hoist Ops
24
Airframe
14
Airframe Exceedance
14
Flight Instruments
11
Near Midair
8
Indicator
11
Birdstrike - No Damage
6
Landing Gear
7
Engine Overtorque
5
Tail Gear box
5
Spacial D
4
Hoist
4
Injury
4
Hydraulics
3
Ground Handling
3
Main Rotor
3
Ship-Helo Ops
3
Tail Rotor
2
Preflight
2
ECS
2
FOD - No Damage
2
Fuel
1
Things Falling Off Aircraft
2
Radar
1
Inadvertent IMC
2
Other
1
Passenger Ops
1
Total
134
Fuel Management
1
Fuel Spill
1
HIFR
1
Rescue Swimmer Ops
1
Landing Ops
1
Total
186
Table 3.3: MH-65 mishap factors frequency counts shown by affected/malfunctioning system and
category.
MH-65 Mishap Briefs (non-privileged)
Impact with Ground During Maintenance Test Flight – Class A: The mishap aircraft ground taxied
to the unit helicopter ramp to conduct a maintenance test flight. Upon completion of the take-off
checklist, the mishap pilot initiated a takeoff in order to conduct the hover controllability portion of the
test flight. While conducting hover controllability checks in the yaw axis, the aircraft impacted the ground
and came to rest on its left side. Total aircraft and facility property damages exceeded $2 million. There
were no reportable injuries. Note: Annual Safety Report and endorsements are complete; estimate Final
Safety Message release by early April 2016.

HSWL SC Mishap Report FY15 Safety and Environmental Health Resources
CG-1131 Aviation Safety Program Page 53of 72
Hoist Cable Sheared – Class C: Hoist cable sheared with two RS performing a direct deployment with
catenary, no injuries. While conducting a Flight Mechanic Syllabus Qualification (Night Rescue
Swimmer) Flight, the Mishap Crew (MC) was executing a direct deployment of the RS to a simulated
survivor (a second RS) using the catenary method and hypothermic double lift pickup. During this (last
hoist) evolution, the Flight Mechanic Under Instruction (FMUI) conned the aircraft away from the RS and
survivor into the catenary position. The aircraft moved back and left faster than the FMUI could pay out
slack and the RS and survivor were dragged through the water. The Flight Mechanic Instructor (FMI)
announced, "shear, shear, shear" and the FMUI sheared the hoist cable. The MC executed the Leaving
Rescue Swimmer On Scene emergency procedure and vectored the cover asset to recover the RS and
survivor. Training was aborted and the Mishap Aircraft (MA) returned to air station.
Hearing Injury – Class C: Mishap member (MM) was performing duties as line crewman at the local
airfield in the vicinity of the compressor shed. After washing the duty aircraft, MM was returning the
wash brushes to the shed when he heard the sound of an air leak coming from the storage cylinder of the
compressor. As MM leaned in to determine the exact location of the leak, the relief valve discharged
immediately next to the MM's ear. The MM reported experiencing a sharp ear pain as well as "muffled"
hearing. The MM reported the incident to a supervisor and was directed to medical care.
Hoist Cable Sheared – Class C: The crew commenced hoisting with the 47 MLB at approximately 50
feet AWL, and as per unit policy utilized the trail line for the first few hoists. After two uneventful hoists,
the crew elected to shift to direct deliveries of the basket to the MLB. Upon delivery of the basket, the
PAC drifted forward and lost sight of the vessel. The PAC adjusted to correct a decent by pulling power
and raising the nose of the aircraft in an attempt re-establish visual contact with the MLB. This resulted in
a rapid climb and the cable became entangled on the MLB's mast. As the aircraft reestablished a stable
hover, the FM observed continued forward drift and attempted to pay out cable as fast as the hoist would
allow. Unable to keep up with the aircraft's movement, the FM called "shear shear shear" as the aircraft
simultaneously experienced a sudden tug from the entangled cable. Immediately following the shear, the
crew PEL'd to a local, uncontrolled airport adjacent to their position, inspected the helicopter for damage,
and RTB'd after clearance was obtained from the Command.
Eye Injury – Class C: After turning the Heat switch on as part of the First Flight of the Day Checks,
(step 12 of the System Equipment checklist), a mist/cloud with a simultaneous fuel smell came out of the
WEMACS nozzle at knee level. The MAC executed the Smoke and Fume Elimination EP. The fuel mist
cloud was visible for approximately 45 seconds before it dissipated. The MAC discussed the abnormality
and noted that none of aircrew felt any ill effects at that time. The MAC then contacted Maintenance
Control to discuss the abnormality. With no other indications the MAC and Maintenance Control felt the
crew and aircraft were safe for departure. The MAC had an uneventful two sortie trip to Cordova, AK.
Shortly after landing in Cordova, the Aircraft Commander (AC) reported irritated eyes and then presented
with blood shot eyes and mucus coming from both eyes. The AC then saw the local optometrist and was
diagnosed with chemical conjunctivitis.
Eye Injury – Class C: While en route, the aircraft was diverted to assist a vessel aground. Upon arriving
on scene, the crew discovered the vessel aground in shoal water, approximately 50 yards from a small
tidal island. The survivors had safely swam from the grounded vessel to the nearby island. The crew
lowered the rescue swimmer to the beach to evaluate the survivors' condition. After a brief discussion, the
crew determined they would need to conduct a hoist of the survivors due to the inability of surface assets
to access the island and a rapidly rising tide. During the hoist brief, the crew selected 30' AGL as the
desired hoisting altitude. As the aircraft descended through 50' AGL to commence the hoist of the first
survivors, the rotor downwash stirred a considerable amount of sand and dust from the beach that blew
sand particles as high as the aircraft's altitude. The pilot flying aborted the hoist, discussed the downwash
effects with the crew, and elected to move the hoisting site to an area of wet hard packed sand closer to

HSWL SC Mishap Report FY15 Safety and Environmental Health Resources
CG-1131 Aviation Safety Program Page 54of 72
the water. Both survivors and the rescue swimmer were hoisted without further incident. After landing,
the FM complained of eye irritation and two pieces of sand were discovered on the surface of his eye.
Landing Gear System – Class D: The aircrew arrived early, and preflighted the aircraft in the hangar as
sunrise had not occurred yet. Because the aircraft still had to be towed outside, the discrepancy regarding
the nose wheel strut lock was left open in ALMIS, and the nose wheel strut lock remained on the aircraft.
After completion of the preflight, the crew dressed out, signed for the aircraft, and briefed while the day
line crew pulled out the aircraft and fueled it to the requested load. The crew embarked the aircraft and
commenced the flight with neither of the pilots or the flight mechanic realizing that the nose wheel strut
lock had not been removed. Upon takeoff, the pilots noticed that the radar light remained illuminated and
elected to continue flight. When the crew attempted to engage the flight director modes in flight, they did
not work properly, indicative of the weight on wheels switch still being compressed, and again, the crew
believed it was a result of the nose wheel not being straight. Upon landing, the crew realized that the nose
wheel strut lock was still installed. After removal of the nose wheel strut lock, an inspection was
conducted with no damage found, and applicable releases were obtained prior to further flight.
Weight and Balance – Class D: MH-65D exceeded max gross weight on deck, sortie aborted, no
damage. As the ready crew prepared to launch on SAR, the Operations Duty Officer (ODO) made a
public address announcement for "max fuel." Maintenance personnel fueled the ready aircraft with 1864
lbs of fuel. The copilot (CP) completed the Before Starting Engines checklist from the left seat with the
flight mechanic (FM), rescue swimmer (RS), and all SAR equipment aboard the aircraft. When the pilot
in command (PIC) boarded the aircraft, the gross weight reached 9660 lbs, exceeding the maximum ramp
weight of 9590 lbs. The aircraft was subsequently secured and grounded.
Fuel System – Class D: An MH65D was assigned to a MEDEVAC case to transport a heart attack victim
and paramedic to a hospital. Due to the urgency of the mission, the crew launched with more fuel than
needed for the route of flight. Enroute, the crew calculated a reasonable weight and followed the red book
guidance in order to jettison fuel for them to arrive at the landing zone at a safe weight while allowing for
takeoff after the victim and paramedic boarded. The crew departed the landing zone with an approximate
weight of 9450 pounds, and elected to conduct a second fuel jettison while over the water due to the
anticipated increased power requirement for the confined area of the hospital's helicopter pad. The crew
finished the second jettison event 8 minutes prior to their arrival at the hospital. While on final approach
to the hospital's helicopter pad, the flight mechanic observed residual fuel from the jettison tube spray
civilian bystanders and several cars. Upon landing, the crew notified hospital security, obtained contact
information for the affected individuals, and ensured that the jettison valves were secured.
HIFR – Class D: During shipboard workups, an MH-65D was conducting the required Helicopter In-
flight Refueling (HIFR) evolution. After connecting the HIFR rig and before taking the load, the FM
noticed the HIFR nozzle was not connected to the attachment hook on the lifting cradle. The FM
immediately paid out cable to keep the HIFR rig on deck and allow for reattachment. The HIFR rig was
then re-hoisted to the aircraft and connected to the fueling receptacle. The aircrew completed the HIFR
checklist and the FM signaled the LSO to start the fuel pump. After receiving approximately 25 gallons,
the FM noticed fuel dripping from the HIFR rig sampling assembly coupling. Shortly thereafter fuel
began to spray inside the aircraft. The FM notified the pilots and signaled the LSO to stop the pump. The
BA, who was sitting in the swimmer seat, noticed the small valve immediately in line before the sample
assembly and directed the FM to close it. Once the valve was secured the fuel stopped spraying. The FM
disconnected the HIFR rig from the refueling receptacle and hoisted it back down to the cutter. The
aircrew then landed safely on the cutter
Hoist Operations – Class D: MH-65D trail line entangled around MLB line handler's neck. Line
disentangled without injury. During a RT-4 night time boat hoisting proficiency flight, MH-65D
delivered the trail line to the deck of the MLB 47 for a dead in the water (DIW) basket hoist. As the FM
lowered the basket to the MLB 47, one crewman pulled in slack on the trail line as a second crewman

HSWL SC Mishap Report FY15 Safety and Environmental Health Resources
CG-1131 Aviation Safety Program Page 55of 72
faked line on the deck with a third safety observer standing by. For a brief moment, a significant amount
of slack appeared in the line and wrapped around the first crewman's neck. The first crewman signaled to
cut the line while attempting to disentangle. The second crewman assisted with the disentanglement as
the safety observer took over handling the trail line. The coxswain noticed the problem and immediately
notified the MH-65D to hold position. The MH-65D held position as the boat crew disentangled the trail
line. After a brief pause to ensure there were no injuries, the MH-65D continued with the evolution.
TALON Engagement – Class D: MH-65D, TALON engagement on landing at CG ramp, TALON probe
damaged. This crew was conducting a daytime Initial Shipboard Syllabus and recurrent training with
CGC during a Deck Landing Qualification (DLQ) round-up. Weather on-scene was VMC with a 500
foot overcast ceiling, three miles visibility with haze, and wind 360/10. After 18 landings the crew
reentered the box pattern and completed the Abbreviated Landing Checklist with the TALON armed.
Before the next landing could be completed, the crew noticed the visibility had deteriorated to
approximately one mile, below the three miles of visibility required for shipboard training. The PM
contacted the cutter and announced their intentions to discontinue training and RTB. The crew climbed to
200 feet, completed the Level Off Checklist and communicated their intentions to RTB. The automated
weather report on ATIS reported overcast at 400 feet with one mile of visibility. The PM contacted the
ATC approach controller and requested a special VFR entry into the class D airspace. The weather en
route was lower than reported at the airfield requiring the crew to fly at approximately 150 feet AGL,
with occasional half mile reduced visibility due to fog. The crew proceeded to the CG ramp and
completed the Landing/Hover and 200 Foot Checklists. The PF performed a no hover landing with 1-2
knots of forward groundspeed. Immediately after touchdown a bang and scraping noise was heard
followed by a second bang. The PF saw the TALON was armed, turned the TALON off, and announced
that the TALON had engaged on the ramp surface. The aircraft was shutdown without further taxiing and
towed to parking.
Engine Rinse – Class E: Engine overtorque during post-flight engine rinse procedure, aircraft secured
with no injuries, engine replaced. At the conclusion of a training sortie, the crew taxied the to the engine
rinse area for a routine post-flight engine rinse. Immediately after fluid was injected into the No.1 engine,
the engine rapidly spooled up causing an engine overtorque. Upon hearing the abnormal engine spool up,
the FM stopped the engine rinse and the pilots quickly shutdown both engines. The aircraft was towed to
the hangar and secured for analysis.
Top Safety Concerns
*Only highest-scoring responses shown; lower-scoring responses were removed but are available on the FSO Portal.
Figure 3.2: Percentage of total MH-65 pilot and aircrew respondents that selected specific safety concern
from fiscal year 2015 operational safety survey.
40%
60%
20%
21%
22%
31%
28%
32%
21%
30%
14%
21%
16%
6%
15%
18%
0%
10%
20%
30%
40%
50%
60%
70%
H-65 Pilot
H-65 Aircrew
Percentage of Total Respondents*
Personnel Shortage
Crew Training
Maintenance Tempo
Ops Tempo
Crew Fatigue
Caring for Crews
Non-Punitive Reporting Culture
Crew Experience Level

HSWL SC Mishap Report FY15 Safety and Environmental Health Resources
CG-1131 Aviation Safety Program Page 56of 72
Top Mishap-Producing Conditions
*Only highest-scoring responses shown; lower-scoring responses were removed but are available on the FSO Portal.
Figure 3.3: Percentage of total MH-65 pilot and aircrew respondents that selected specific mishap
producing condition from fiscal year 2015 operational safety survey.
HC-130H/J Performance Review
HC-130 Mishaps by OPMODE (FY 2011-2015)
Figure 4.1: Total number of mishaps shown by fiscal year and OPMODE. Total flight hours presented in
trendline.
29
25
39
37
29
26
8
16
18
9
16
11
17
9
5
0
5000
10000
15000
20000
25000
0
10
20
30
40
50
60
70
80
FY11
FY12
FY13
FY14
FY15
Flight Hours
Number of Mishaps
Ground
Flt-Rel
Flight
Flt Hours
29%
20%
31%
18%
23%
22%
20%
8%
12%
10%
22%
23%
16%
12%
16%
13%
0%
5%
10%
15%
20%
25%
30%
35%
H
-
65 Pilot
H
-
65 Aircrew
P
e
r
c
e
n
t
a
g
e
o
f
T
o
t
a
l
R
e
s
p
o
n
d
e
n
t
s
*
Complacency/Inattention
Poor Weather
Fatigue
Congested Operating Area
Maintenance Error
Rushing
Unknown/Unidentified Hazard
Inexperience

HSWL SC Mishap Report FY15 Safety and Environmental Health Resources
CG-1131 Aviation Safety Program Page 57of 72
HC-130 Mishaps by Class
Class A
Class B
Class C
Class D
Class E
Total
FY15
0
1
2
29
11
43
3-yr avg
0
0
3.7
39.3
17.0
60.0
5-yr avg
0
0
4.4
42.8
19.0
66.2
Table 4.1: HC-130 mishaps by class compared to three (FY12-14) and five (FY10-14) year averages.
HC-130 Mishaps by Causal Factor (FY2015)
Materiel
Physical
Environment
All HF
HF -
Aircrew
HF -
Maintenance
Total
FM
25
2
2
0
2
29
%
86%
7%
7%
0%
7%
FRM
2
3
4
3
1
9
%
22%
33%
44%
33%
11%
AGM
1
0
4
1
3
5
%
20%
0%
80%
20%
60%
All HC-130
28
5
10
4
6
43
%
65%
12%
23%
9%
14%
Table 4.2: Total causal factor numbers are comprised of materiel, physical environment, and all HF data.
All HF numbers are comprised of HF-Aircrew and HF- Maintenance data.
HC-130 Mishap Factors
Materiel Factor Mishaps
Non-Materiel Mishaps
Breakdown by affected /
malfunctioning system
Breakdown by category
Engine
8
Maintenance Error
6
Propeller
5
Birdstrike
3
Electrical
4
Laser Exposure
2
Air Conditioning System
2
Physiological Event
1
Flight Controls
2
Overtorque
1
Landing Gear
2
Inadvertent Liferaft Inflation
1
Hydraulics
2
Fuel Management
1
Fuel System
1
Total
15
Flight Instruments
1
Fire Protection System
1
Total
28
Table 4.3: HC-130 mishap factors frequency counts shown by affected/malfunctioning system and
category.

HSWL SC Mishap Report FY15 Safety and Environmental Health Resources
CG-1131 Aviation Safety Program Page 58of 72
HC-130 Mishap Briefs (non-privileged)
Propeller Overspeed – Class B: During a standard departure climb an HC-130H experienced a number
four propeller overspeed with an associated propeller low oil light indication. The crew declared an
emergency, shutdown the number four engine and safely returned to the departure airfield. Post-mishap
inspections of the powerplant and propeller, maintenance personnel estimated over $650 thousand in
aircraft damage and repair costs. Note: Annual Safety Report and endorsements complete; estimate Final
Safety Message release by early April 2016.
Bird Strike – Class C: Upon landing, with the aircraft decelerating on roll out, a bald eagle impacted the
#3 propeller. After impact, the aircrew experienced significant aircraft vibrations with no secondary
indications on the engine instruments. The Pilot in Command immediately directed an emergency engine
shutdown procedure of the #3 engine. Once the engine was shutdown, the vibration stopped, and the
aircrew taxied to park without further incident.
Things Falling off Aircraft – Class D: Number 2 inboard engine cowling departed the aircraft.
Approximately two hours into the flight, the crew members in the back of the aircraft stated that they
heard strange noises and felt vibrations emanating from the tail of the aircraft. The FE went to the cargo
compartment to investigate while the pilots monitored the engine instruments. The FE thoroughly
inspected the cargo compartment and rear of the aircraft and found no discrepancies. While walking back
to the flight deck the FE looked out the left scanner window and noticed that the number 2 engine inboard
cowling was missing and immediately notified the pilots of the missing panel. The pilot flying remained
on autopilot and kept the aircraft in straight and level flight. The crew completed a thorough visual
inspection through the aircraft windows and did not note any holes or dents on the airframe, the only
damage visible from the inside of the aircraft was a minor paint scratch on the leading edge of the wing
inboard of the number 2 engine. The horizontal stabilizer was inspected and appeared to be undamaged.
The pilots declared an emergency with ATC and diverted to a military airfield because of the noise and
slight vibrations that were still emanating from the rear of the aircraft. The pilot's completed a
controllability check IAW the flight manual, all controls responses and engine instruments remained
normal. To limit aircraft configuration changes the PIC elected to complete a flaps up landing. The PIC
also elected to avoid using reverse because of the possibility of pulling the HF wire antenna into a
prop/engine if it had been damaged. The landing and full stop were uneventful.
Flaps – Class D: While conducting a simulated 3 engine go-around for an AC syllabus, the flaps stopped
moving at approximately 37 percent during retraction. The PNF stopped flap lever movement and
returned the flap lever to the indicated position. The PF did not note any adverse flight controls issues.
The IP announced that all training was terminated and then cleaned up from the simulated maneuver. The
BA confirmed that the flaps visually appeared to be slightly less than 50 percent both at the flap control
motor and outside, but that they appeared to be even with each other. The BA noted that the utility
hydraulic system appeared to be over-serviced, and that the wing flap selector valve was slightly moist.
The crew requested traffic advisories from ATC, initiated a climb to 5000 feet, and conducted
troubleshooting in accordance with the Flight Manual Flap System Failure checklist. The crew climbed
to 10000 feet to perform a Controllability Check and noted no deficiencies. The crew then conducted a
visual approach and landed at home airfield using 0 percent flaps speeds.
Fuel System / Skin Injury – Class D: While taking a fuel sample using an extended pogo tool, the sump
valve began to leak (moderate trickling) and would not close off. After multiple attempts trying to reset
the valve, the member had to install an emergency fuel shutoff valve. During instillation of the new
valve, the fuel ran down the members arm covering the forearms, armpits, and upper chest with a
continuous flow of fuel for about 3 seconds. Once getting the shutoff valve completely screwed into
position the leak was secured. At this point, the member was doused in fuel and directed to take a shower
to decontaminate. The member received basic first-aid treatment for a small rash and was released by
medical to return to work the following day.

HSWL SC Mishap Report FY15 Safety and Environmental Health Resources
CG-1131 Aviation Safety Program Page 59of 72
Hydraulic System – Class D: While climbing through 1500' MSL on flight planned route, the basic
aircrewman (BA) reported a major hydraulic leak coming from the ramp area. While the flight engineer
(FE) pulled out the flight manual, utility hydraulic system pressure was confirmed to be zero. CP
followed the flight manual procedure and secured the Utility Hydraulic Pumps and the Utility Suction
Boost Pump. The BA then checked the Utility Reservoir and confirmed that it was empty. The flight crew
established an orbit north of the departure airport to discuss options since the situation had stabilized and
all checklists had been completed. The crew suspected the leak to be caused by a failure of the rudder
utility boost pack, which could potentially be isolated with shutoff valves. Per the 1C-130H-1, if the leak
can be isolated, the system is to be reserviced with hydraulic fluid and the flight will land as soon as
practicable. While climbing to flight planned altitude, FE went to the rear of the aircraft to inspect for the
source of the leak. The FE discovered the source was upstream of the shutoff valves and could not be
isolated. As per the 1C-130H-1, if the leak cannot be isolated, the flight will land as soon as possible. At
that time, the crew was approximately 30NM north of the nearest suitable landing site, and elected to
divert there. The crew alerted ATC of the divert and impending emergency landing. The PIC coordinated
with ATC for turns in holding while working through the 'Manual Gear Extension (Main Gear)' and
'Emergency Hydraulic Extension (Nose Gear)' emergency procedures. The PIC also alerted ATC that the
aircraft would be unable to taxi clear of the runway once safely-landed. After completing extension of
landing gear, PIC took the controls and performed a no-flap landing from the right seat and safely stopped
6000 feet down the 11000 foot runway.
Cargo Handling – Class D: HC-130H unintended CASPER pallet departure from cargo ramp on ground,
no damage. On a weekend duty day, Mishap Maintainer No. 1 (MM1) was assigned to move a CASPER
pallet from one aircraft to another. MM1 enlisted the help of Mishap Maintainer No. 2 (MM2) and sent
that individual to retrieve and operate the fork lift. Before MM2 could properly position the forklift at the
aft ramp, MM1 released the locks holding the CASPER pallet in place. Immediately after the locks were
released, the CASPER pallet began an uncontrolled roll with accelerating speed. The aft end of the pallet
departed the aircraft and struck the hangar deck from a 3 foot fall. The pallet came to rest at a thirty
degree angle with the aft end on the ground and the forward end resting on the lip of the cargo ramp.
Flight Controls – Class D: The CP’s rudder cable was pinched between an access panel and the fuselage
during maintenance causing binding in the flight controls; minor damage occurred. A routine maintenance
inspection was performed inside the nosewheel compartment of the aircraft in conjunction with a
comprehensive hourly inspection. The aircraft was awaiting parts and did not fly for 14 days. When it was
dispatched for flight the aircraft was rejected by the crew for noticeable vibrations and excessive
resistance in the rudder pedals. Maintenance trouble-shooting led to the replacement of the rudder boost
pack. The aircraft passed subsequent ground checks and a check flight with no discrepancies noted. The
aircraft was dispatched on an eight day deployment and flew 40.9 hours. After returning from the
deployment, the aircraft was dispatched and rejected by the crew for excessive resistance and grinding
when moving the rudder pedals. Maintenance performed an inspection of the entire rudder control system
and discovered the CP rudder cable was pinched by the left hand rudder access panel.
Engine Oil System – Class E: On climb out, during the after takeoff checklist, the FE noticed that the oil
cooler flap position for the number four engine was at 0%. The FE moved the oil cooler flap position
switch from the automatic position and held it in the open position. The oil cooler flap remained in the 0%
position and the oil temperature began to rise out of limits to 90 degrees. The crew elected to return to
departure airport which was approximately 10 minutes away. The aircrew made an uneventful landing
and secured the engine after landing roll out when the oil temperature was 99 degrees.
Engine Power Loss – Class E: After leveling off from initial climb, the crew noticed the aircraft yaw to
the right. The Aircraft Commander (AC) scanned the engine instruments and noticed the number four
engine was producing 700-800 less horsepower (HP) than the other engines but, was returning to normal.
Additionally, the AC noted that all power levers were matched. Unable to identify the cause of the

HSWL SC Mishap Report FY15 Safety and Environmental Health Resources
CG-1131 Aviation Safety Program Page 60of 72
horsepower fluctuation, the crew referenced the emergency procedures handbook and elected to conduct a
precautionary engine shutdown IAW the Significant HP Oscillation guidance. The crew conducted a three
engine approach and full stop landing without further incident.
HC-130 Top Safety Concerns
*Only highest-scoring responses shown; lower-scoring responses were removed but are available on the FSO Portal
Figure 4.2: Percentage of total HC-130 pilot and aircrew respondents that selected specific safety concern
from fiscal year 2015 operational safety survey.
HC-130 Top Mishap-Producing Conditions
*Only highest-scoring responses shown; lower-scoring responses were removed but are available on the FSO Portal
Figure 4.3: Percentage of total HC-130 pilot and aircrew respondents that selected specific mishap
producing condition from fiscal year 2015 operational safety survey
42%
52%
18%
21%
26%
26%
38%
36%
34%
41%
24%
24%
17%
8%
24%
20%
0%
10%
20%
30%
40%
50%
60%
C-130 Pilot
C-130 Aircrew
Percentage of Total Respondents*
Personnel Shortage
Crew Training
Maintenance Tempo
Ops Tempo
Crew Fatigue
Caring for Crews
Non-Punitive Reporting Culture
Crew Experience Level
32%
27%
21%
16%
30%
38%
36%
13%
21%
11%
19%
28%
22%
14%
21%
23%
0%
5%
10%
15%
20%
25%
30%
35%
40%
C-130 Pilot
C-130 Aircrew
Percentage of Total Respondents*
Complacency/Inattention
Poor Weather
Fatigue
Congested Operating Area
Mechanical Failure
Rushing
Unknown/Unidentified Hazard
Inexperience

HSWL SC Mishap Report FY15 Safety and Environmental Health Resources
CG-1131 Aviation Safety Program Page 61of 72
HC-144A Performance Review
HC-144 Mishaps by OPMODE (FY 2011-2015)
Figure 5.1: Total number of mishaps shown by fiscal year and OPMODE. Total flight hours presented in
trendline.
HC-144 Mishaps by Class
Class A
Class B
Class C
Class D
Class E
Total
FY15
0
0
3
50
2
55
3-yr avg
0
0
2..3
33.7
6.3
42.3
5-yr avg
0
0
1.8
23.8
4.6
30.2
Table 5.1: HC-144 mishaps by class compared to three and five year averages.
HC-144 Mishaps by Causal Factor (FY2015)
Materiel
Physical
Environment
All HF
HF -
Aircrew
HF -
Maintenance
Total
FM
17
1
2
2
0
20
%
85%
5%
10%
10%
0%
FRM
11
9
10
8
2
30
%
37%
30%
33%
27%
7%
AGM
0
0
5
1
4
5
%
0%
0%
100%
20%
80%
All HC-
144
28
10
17
11
6
55
%
51%
18%
31%
20%
11%
Table 5.2: Total causal factor numbers are comprised of materiel, physical environment, and all HF data.
All HF numbers are comprised of HF-Aircrew and HF- Maintenance data..
7
23
31
16
20
7
11
11
8
30
2
6
10
11
5
0
2000
4000
6000
8000
10000
12000
14000
16000
0
10
20
30
40
50
60
FY11
FY12
FY13
FY14
FY15
Flight Hours
Number of Mishaps
Ground
Flt-Rel
Flight
Flt Hours

HSWL SC Mishap Report FY15 Safety and Environmental Health Resources
CG-1131 Aviation Safety Program Page 62of 72
HC-144 Mishap Factors
Materiel Factor Mishaps
Non-Materiel Mishaps
Breakdown by affected /
malfunctioning system
Breakdown by category
Engine
6
Maintenance Error
6
Electrical
4
Laser Exposure
6
Flight Controls
4
Airframe Exceedance
5
Hydraulics
4
Birdstrike
2
HF Antenna
3
Landing Gear
1
Propeller
2
Overtorque
1
Landing Gear
2
Airframe Jacking Ops
1
Air Conditioning System
1
Fuel Management
1
Airframe
1
Physiological Event
1
Flight Instruments
1
Preflight Operations
1
Total
28
Near Midair
1
Aerial Delivery
1
Total
27
Table 5.3: HC-144 mishap factors frequency counts shown by affected/malfunctioning system and
category.
HC-144 Mishap Briefs (non-privileged)
Overtorque – Class C: Overtorque of both powerplants while climbing away from the water after
completing a night identification pass. Engine exceedance data indicated the number 1 powerplant
reached 130 percent torque for 3 seconds and the number 2 powerplant reached 113 percent torque. The
number 1 powerplant exceeded the transient torque limit of 125 percent and required replacement of the
propeller hub assembly and four propeller blades.
Fuel Management – Class D: While conducting a logistics mission an HC144A landed below the fuel
reserves required by COMDTINST M3710.1G. En route, the crew experienced greater than forecasted
headwinds. Sixty miles northeast of the destination, with approximately 1100-1150 pounds of fuel
remaining, the HC144A received indirect vectors for weather and traffic. The vectors guided the
HC144A south of the destination and over the alternate, before reversing direction to join a final to the
east. The crew landed with the #2 FUEL LOW caution illuminated and a total of 560 lbs of fuel.
Pitot/Static Icing – Class D: HC-144 experienced a frozen left pitot/static probe inflight. The HC-144
experienced icing conditions at FL200 with an outside temperature of -10 degrees Celsius. The PF (Left
Seat) noticed the airspeed slowly decrease from 150 KIAS to 45 KIAS and received an IAS mismatch
indication on the Pilot and Copilot MFD. Both the Pilot and Copilot verified the airspeed discrepancy by
referencing the CP MFD, IESI, and AOAs. The crew decided to transfer the controls to the Copilot and
requested a descent to vacate icing conditions. After descending 4,000 ft, the Pilot's airspeed indication
was recovered. Indications remained normal for the remainder of the flight.
Landing Gear – Class D: HC-144 flight with nose landing gear lock installed; uneventful landing; no
damage. After takeoff the HC-144 crew experienced an abnormal landing gear indication following gear
retraction. The CP noticed the gear handle light flashing along with the Nose Landing Gear (NLG) visual
indicator, green (in the down position) and the Main Landing Gear (MLG) visual indicator, red (in the up

HSWL SC Mishap Report FY15 Safety and Environmental Health Resources
CG-1131 Aviation Safety Program Page 63of 72
position). Using the FLIR/camera, the crew performed an external inspection confirming the NLG was in
the properly aligned down position and the MLG had been fully retracted. The PIC asked the crew to
check if the NLG locking collar and pin were stowed. A crewman confirmed the NLG collar, pin and
flag were not onboard the aircraft. The entire crew discussed the situation and came to the conclusion
that the NLG locking collar was still installed. The PIC initiated the "Abnormal Landing Gear
Indication" procedure, which led to the "Emergency Landing Gear Extension" procedure. The crew
declared an emergency, to ensure crash rescue presence during landing, and performed an uneventful
landing. After landing with no further issues, the crew stopped on the runway for gear inspection. With
airfield crash rescue on runway, the crew thoroughly briefed a safe method for inspection. The crew
surveyed from a safe distance, avoiding moving parts and keeping personnel free from wheel wells and
under carriage of the aircraft. Once a crewmember confirmed the NLG lock was installed and there was
no damage to surrounding components or the airframe itself, the crew taxied back (with lock installed) to
the hangar with no further issues.
Engine Oil System – Class E: Low oil pressure on a C-144 #2 engine inflight led to the mishap crew
shutting down the engine per the EP. A PEL was completed without incident. While enroute to their
assigned mission, the mishap pilots heard an aural warning with no associated visual indications on the
caution advisory system. After scanning the Integrated Engine Display System, the mishap pilots
discovered the oil pressure reading on the right (#2) engine in the red zone at approximately 17-18 psi.
The #2 engine oil pressure warning light (2E/OIL P) then illuminated on the IEDS. The crew performed
the Engine Oil Pressure Low emergency procedure which led to an inflight shutdown of the #2 engine.
The mishap crew declared an emergency with ATC and completed a full-stop single-engine landing at a
nearby military airfield.
HC-144 Top Safety Concerns
*Only highest-scoring responses shown; lower-scoring responses were removed but are available on the FSO Portal.
Figure 5.2: Percentage of total HC-144 pilot and aircrew respondents that selected specific safety concern
from fiscal year 2015 operational safety survey
58%
75%
38%
22%
12%
20%
23%
51%
26%
37%
24%
26%
21%
8%
20%
28%
0%
10%
20%
30%
40%
50%
60%
70%
80%
C-144 Pilot
C-144 Aircrew
Percentage of Total Respondents*
Personnel Shortage
Crew Training
Maintenance Tempo
Ops Tempo
Crew Fatigue
Caring for Crews
Non-Punitive Reporting Culture
Crew Experience Level

HSWL SC Mishap Report FY15 Safety and Environmental Health Resources
CG-1131 Aviation Safety Program Page 64of 72
HC-144 Top Mishap-Producing Conditions
*Only highest-scoring responses shown; lower-scoring responses were removed but are available on the FSO Portal.
Figure 5.3: Percentage of total HC-144 pilot and aircrew respondents that selected specific mishap
producing condition from fiscal year 2015 operational safety survey.
35%
24%
12%
18%
23%
33%
17%
8%
21%
6%
18%
25%
15%
11%
17%
27%
0%
5%
10%
15%
20%
25%
30%
35%
40%
C-144 Pilot
C-144 Aircrew
Percentage of Total Respondents*
Complacency/Inattention
Poor Weather
Fatigue
Congested Operating Area
Automation Mismanagement
Rushing
Poorly Designed (or lack of) Procedure
Inexperience
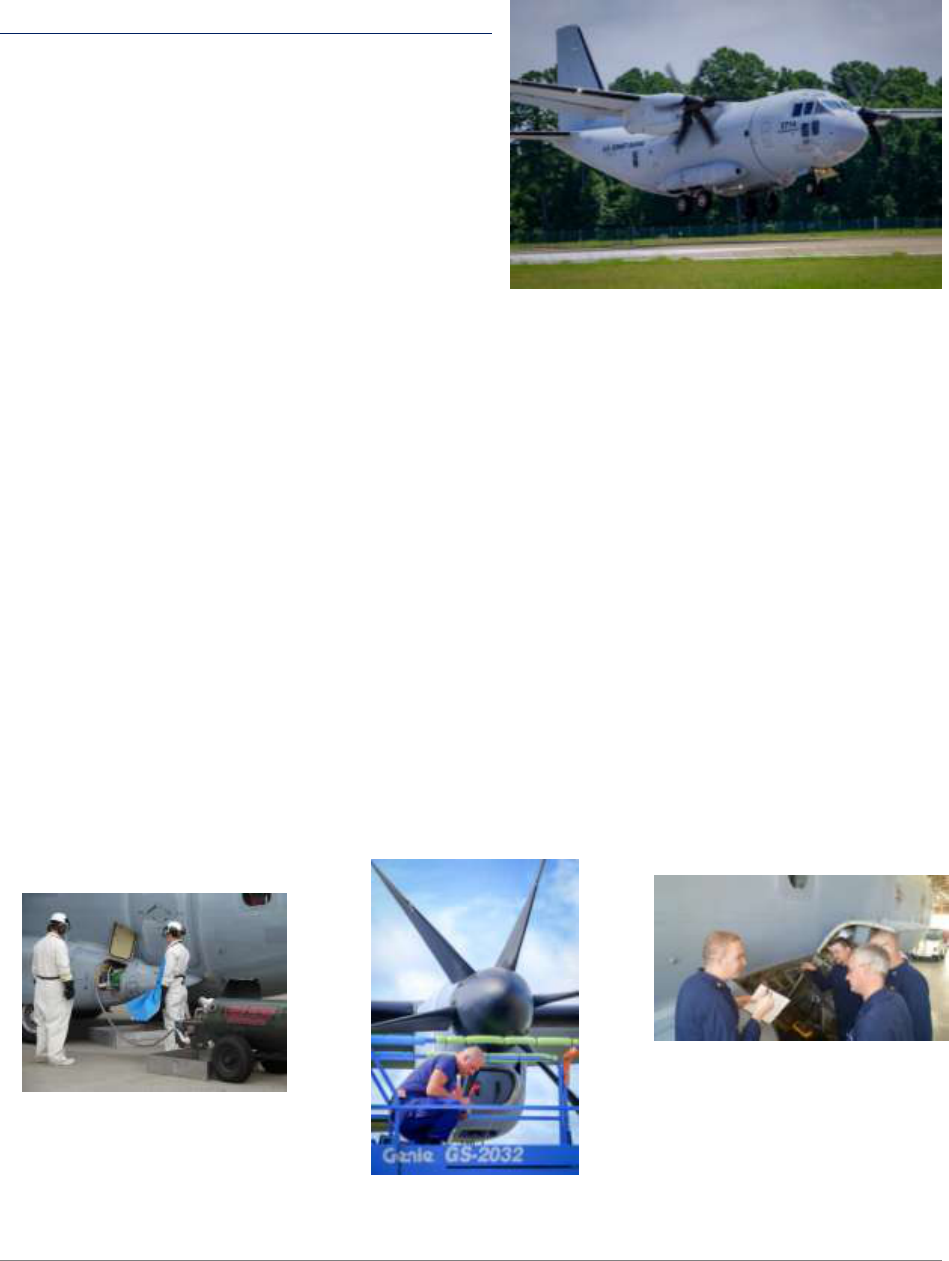
HSWL SC Mishap Report FY15 Safety and Environmental Health Resources
CG-1131 Aviation Safety Program Page 65of 72
HC-27J Performance Review
The C-27J Aircraft Project Office (APO) was
established through a memorandum from CG-711 and
CG-931. As the C-27J community grew from infancy
in FY2015, great strides were made in solidifying a
generative safety culture for the next 30 years of
operation.
With the assistance of NAVAIR, the Coast Guard
established initial airworthiness by adopting OEM,
U.S. Air Force and U.S. Army aircraft engineering and
operational limitations. The APO began systematically
addressing the current airworthiness limitations and presented mitigating controls to either permanently
adopt or lift restrictions to the Aviation Resource Council. By adopting best practices from previous
acquisition projects and conducting a hazard/risk analysis, the APO implemented initial operational
restrictions. These restrictions included Pilot/Crew experience, training limitations, mission execution and
increased weather minimums.
C-27J APO developed a safety sharing relationship through visits with the US Air Force, Italian Air
Force, the Royal Australian Air Force and multiple international users via the Spartan Users Group
(SUG). These relationships have helped mitigate many of the unknown risks associated with fielding a
new asset.
Working with multiple HQ units and CG AIRSTA E-City, the APO contributed to the development of an
Aviation LOX syllabus and Aviation LOX Instructor syllabus.
The C-27J APO reported four mishaps in FY2015. Three of the reports were flight related and one was a
ground mishap. The flight related mishaps addressed the braking system (two reports) and a delaminated
window during icing conditions. The ground mishap involved the unintentional inhalation of fuel vapors
during fuel cell work.
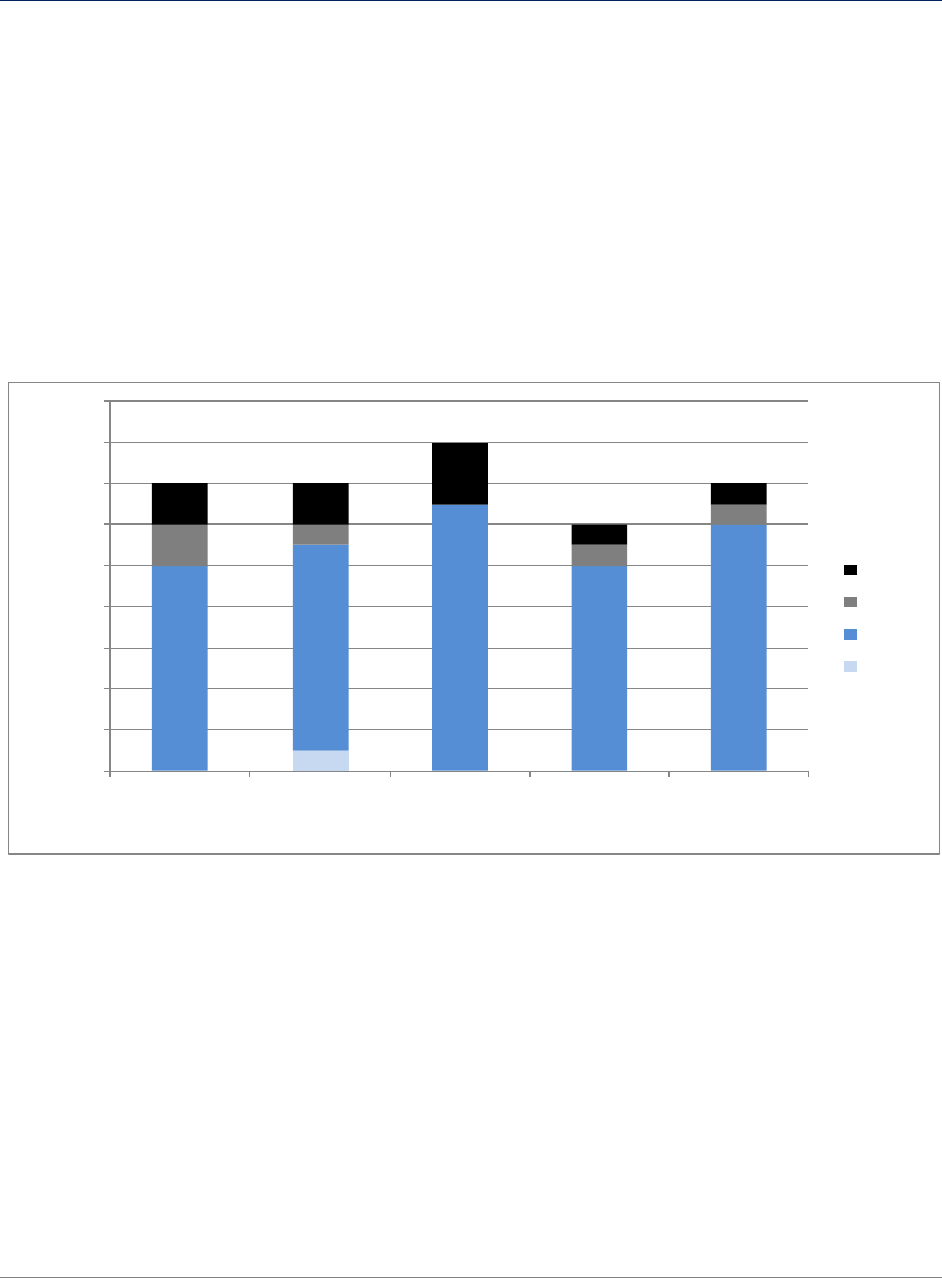
HSWL SC Mishap Report FY15 Safety and Environmental Health Resources
CG-1131 Aviation Safety Program Page 66of 72
Overall Fleet Considerations
Midair/Near Midair Collisions (MAC/NMAC) – All Aircraft Types
Per COMDTINST M3710.1G, “A Near Midair Collision is an incident where a possibility of
collision occurs as a result of proximity of less than 500 feet to another aircraft (excluding
normal formation or air intercept flight), or a report is received from a pilot or a flight crew
member stating that a collision hazard existed between two or more aircraft.” “A Serious Near
Midair Collision is an incident where a possibility of a collision occurs, and evasive action
and/or bodily injury occurs as a result.”
NMAC incidents in FY2015 totaled 14. Eight involved general aviation aircraft and three
involved drones.
Near Midair Collisions by Time of Day
Figure 6.1: Total number of near midair collisions by fiscal year and time of day.
1
10
10
13
10
12
2
1
1
1
2
2
3
1
1
0
2
4
6
8
10
12
14
16
18
FY11
FY12
FY13
FY14
FY15
Number of Incidents
Fiscal Year
Night
Dusk
Day
Dawn

HSWL SC Mishap Report FY15 Safety and Environmental Health Resources
CG-1131 Aviation Safety Program Page 67of 72
Near Midair Collisions by Aircraft Type
Figure 6.2: Total number of near midair collisions in fiscal year 2015 by aircraft type.
Laser Exposure - Aviation
During FY2015 there were 52 reported incidents of external persons aiming LASERs at in-flight
aircraft. While no crew members were permanently injured, some encountered temporary
injuries that did require medical treatment. Most events occurred during the early evening
(1900-2200 local). Air Station Atlantic City reported the most incidents with 14, followed by
Air Station Borinquen with eight.
Figure 7.1: Total number of laser exposures by fiscal year and whether crew experienced symptoms.
8
3
1
1
1
0
1
2
3
4
5
6
7
8
9
General
Aviation
Drone
Military - Jet
Military - Helo
Ultralight
Number of Incidents
Aircraft Type
3
5
9
3
4
17
30
35
29
48
0
10
20
30
40
50
60
FY11
FY12
FY13
FY14
FY15
Number of Incidents
Fiscal Year
Crew Experienced No
Symptoms
Crew Experienced Symptoms

HSWL SC Mishap Report FY15 Safety and Environmental Health Resources
CG-1131 Aviation Safety Program Page 68of 72
Figure 7.2: Total number of laser exposures in fiscal year 2015 by hour of day.
Figure 7.3: Total number of laser exposures in fiscal year 2015 by month.
Hoist Mishaps
In FY2015, a total of 36 hoist-related mishaps were reported. Of these incidents, 18 occurred
during the day, two at dusk, and 16 occurred at night.
RW Hoist Foul/Shear Event Summary
RB-M’s were the most frequent CG asset involved in the boat hoist mishaps (there were 10
occurrences), followed by the MLB-47 with 6 events.
4
7
21
13
4
1
0
1
0
5
10
15
20
25
1800
1900
2000
2100
2200
2300
2400
0100
Number of Incidents
Hour of Day
3
2
4
4
1
6
8
2
3
10
4
5
0
2
4
6
8
10
12
Jan
Feb
Mar
Apr
May
Jun
Jul
Aug
Sep
Oct
Nov
Dec
Number of Incidents
Month

HSWL SC Mishap Report FY15 Safety and Environmental Health Resources
CG-1131 Aviation Safety Program Page 69of 72
Figure 8.1: Total number of cable fouls and cable shears by fiscal year.
Hoist-related RS Injury/Shear Events
Figure 8.2: Total number of rescue swimmer injuries by cable shear category and fiscal year.
3
2
10
8
8
1
5
6
8
14
0
5
10
15
20
25
FY11
FY12
FY13
FY14
FY15
Number of Incidents
Fiscal Year
Device/Cable Foul (No
Shear)
Cable Shear/Separation
2
4
7
4
6
2
2
3
2
0
2
4
6
8
10
12
FY11
FY12
FY13
FY14
FY15
Number of Incidents
Fiscal Year
RS Injury/Cable Shear
RS Injury/No Cable Shear
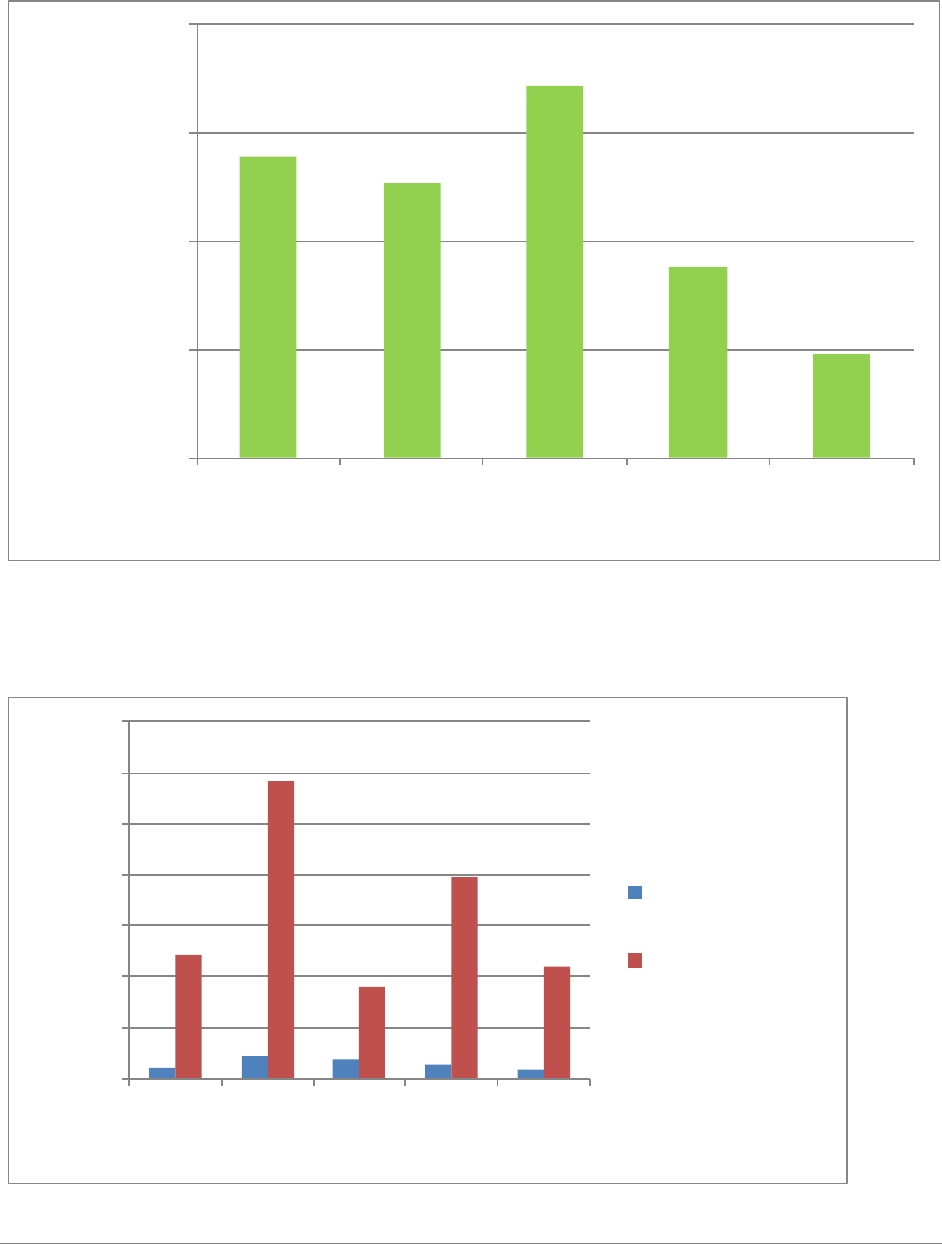
HSWL SC Mishap Report FY15 Safety and Environmental Health Resources
CG-1131 Aviation Safety Program Page 70of 72
Aviation Maintenance Human Factors
Cost of Mishaps with a Maintenance HF Causal/Contributing Factor
Figure 9.1: Total cost of maintenance related mishaps with human factors as causal/contributory by fiscal
year.
Number of Aviation Maintenance-Related Injuries and Days Lost Work
Figure 9.2: Total number of maintenance related injuries and lost work days by fiscal year.
$1,393,734
$1,269,045
$1,718,573
$881,380
$480,119
$0
$500,000
$1,000,000
$1,500,000
$2,000,000
FY11
FY12
FY13
FY14
FY15
Cost in Dollars
Fiscal Year
11
22
18
14
9
122
292
90
197
110
0
50
100
150
200
250
300
350
FY11
FY12
FY13
FY14
FY15
Number of Incidents
Fiscal Year
Injuries
Days Lost Work or
Restricted Duty

HSWL SC Mishap Report FY15 Safety and Environmental Health Resources
CG-1131 Aviation Safety Program Page 71of 72
Post-Mishap Corrective Actions
The table below lists aviation FDMs released since last year’s report and recommended actions
from fleet units.
Total
DA/RA
Closed -
Complete
Pending –
Active Review
Pending –
Pre-
Decision
Pending -
Policy
FDM CG6539*
4
3
1
-
-
FDM CG6508**
10
6
-
4
-
Unit Mishap
Reports
97
17
7
71
2
Table 10.1: Post-Mishap Corrective Actions by Category
*CG6539 (Class A flight-related mishap, HITRON Jacksonville, occurred Aug 2012; FDM released Nov 2014)
**CG6508 (Class B flight mishap, Air Station New Orleans, occurred Dec 2012; FDM released Mar 2015)
Safety Standardization Visits
We had another great year of visits in FY15! We continue to observe highly engaged unit
command cadre, FSOs and safety staffs who embrace strong safety cultures and consistently
offer a steady stream of great ideas to share with the fleet. Each visit included self assessments
and final summaries using the recently developed Aviation Safety Assessment Tool (ASAT).
We encourage continued use of the ASAT during FSO pass downs, change of commands, and
prior to unit safety standardization visits to help determine levels of unit compliance and
maturity for your respective unit SMS. There were a total of nine visits last year including some
unprecedented trips to facilities that normally fly below the radar. We will continue to widen our
aperture and explore how we can bring value to operations that extend beyond traditional
missions and facilities. We extend our special thanks to Clearwater, Miami, Sacramento, ATC
Mobile, C-130H STAN, C-130J STAN, Humboldt Bay, Elizabeth City, and the HC-27J Asset
Project Office for hosting us this year. The chart below provides a summary of aggregated
safety standardization visit results for FY15.

HSWL SC Mishap Report FY15 Safety and Environmental Health Resources
CG-1131 Aviation Safety Program Page 72of 72
Table 11.1: Aggregated Safety Visit Standardization Results for Fiscal Year 2015
Safety
Policy
Safety
Boards
Key
Safety
Staff
Mishap
Response
Planning
Safety
Docs
Hazard ID
and Task
Analysis
Assess &
Mitigate
Monitor
Inspect
Safety
Report &
Feedback
Stand
Down
Training
Edu
Mean
0.97
0.64
0.83
0.79
0.85
0.83
0.77
0.80
0.75
0.83
0.79
0.90
0.73
Hi
1.00
0.93
0.95
0.90
1.00
1.00
1.00
1.00
1.00
1.00
1.00
1.00
1.00
Lo
0.81
0.36
0.54
0.55
0.75
0.38
0.45
0.13
0.17
0.41
0.00
0.79
0.35
97%
64%
83%
79%
85%
83%
77%
80%
75%
83%
79%
90%
73%
0%
10%
20%
30%
40%
50%
60%
70%
80%
90%
100%
Compliance / Maturity Level
U.S. Coast Guard Aviation Safety Assessment Summary
Safety Risk MgmtSafety Policy Safety Assurance Safety Promotion
